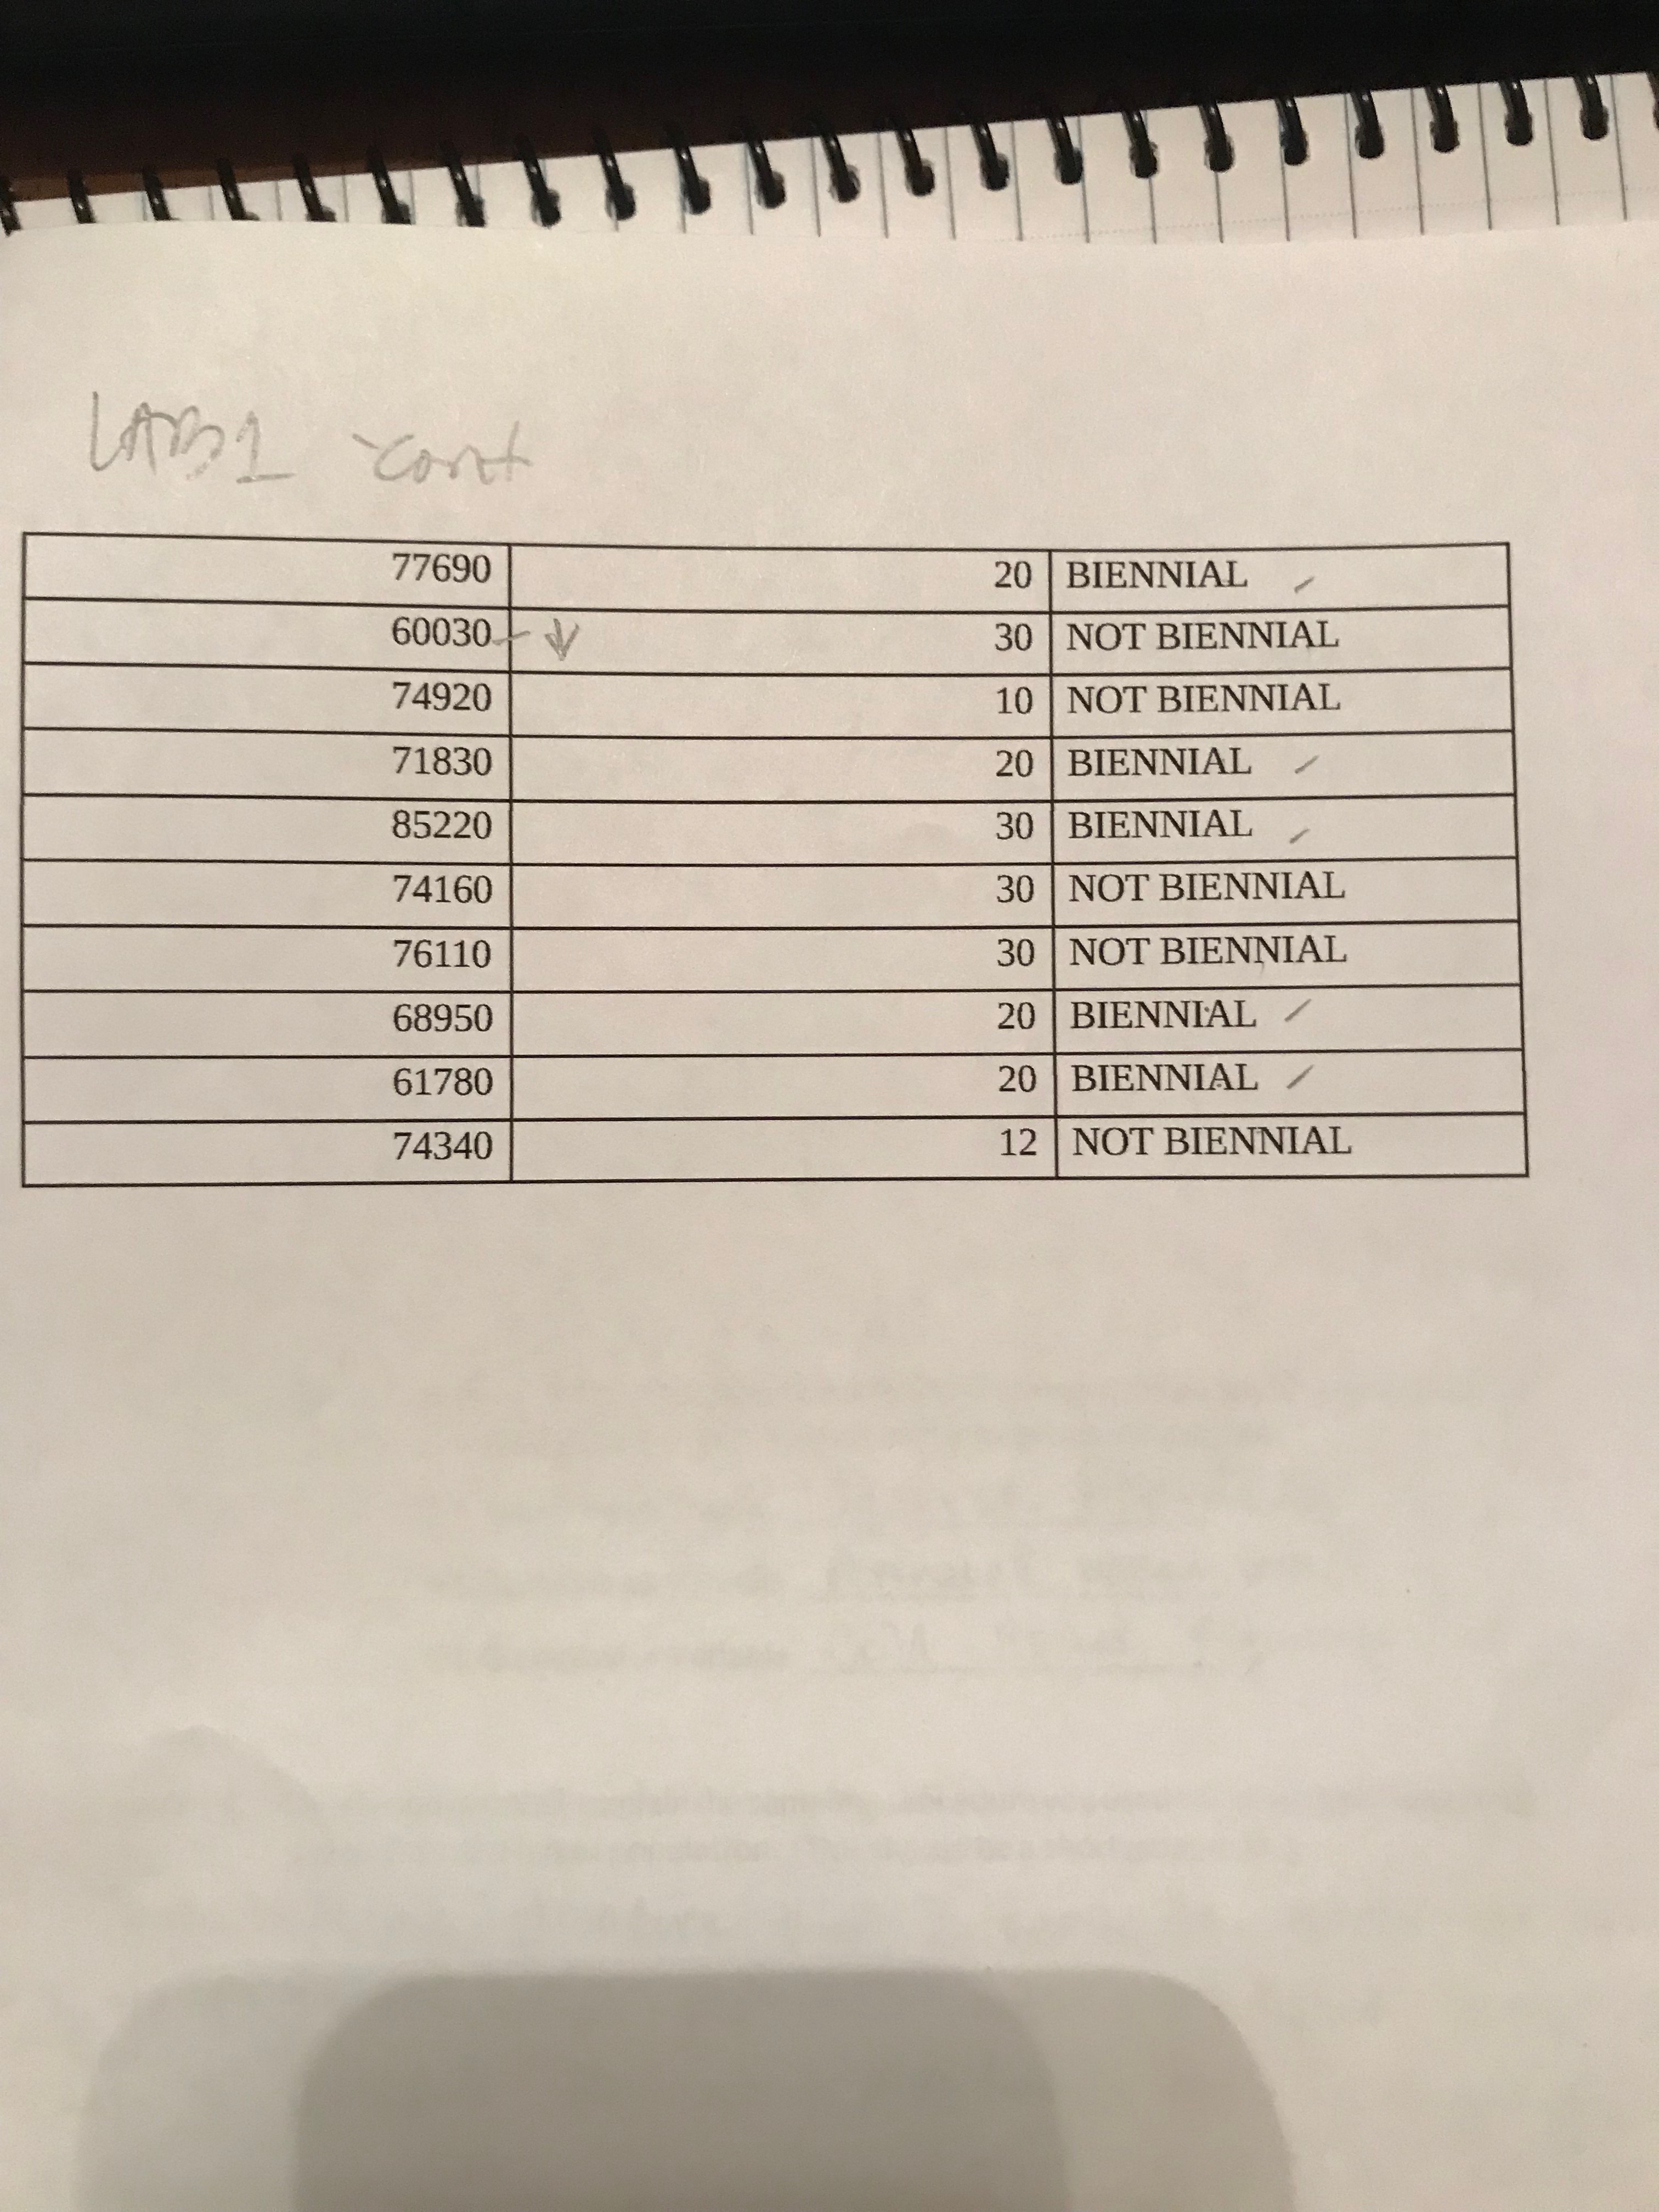
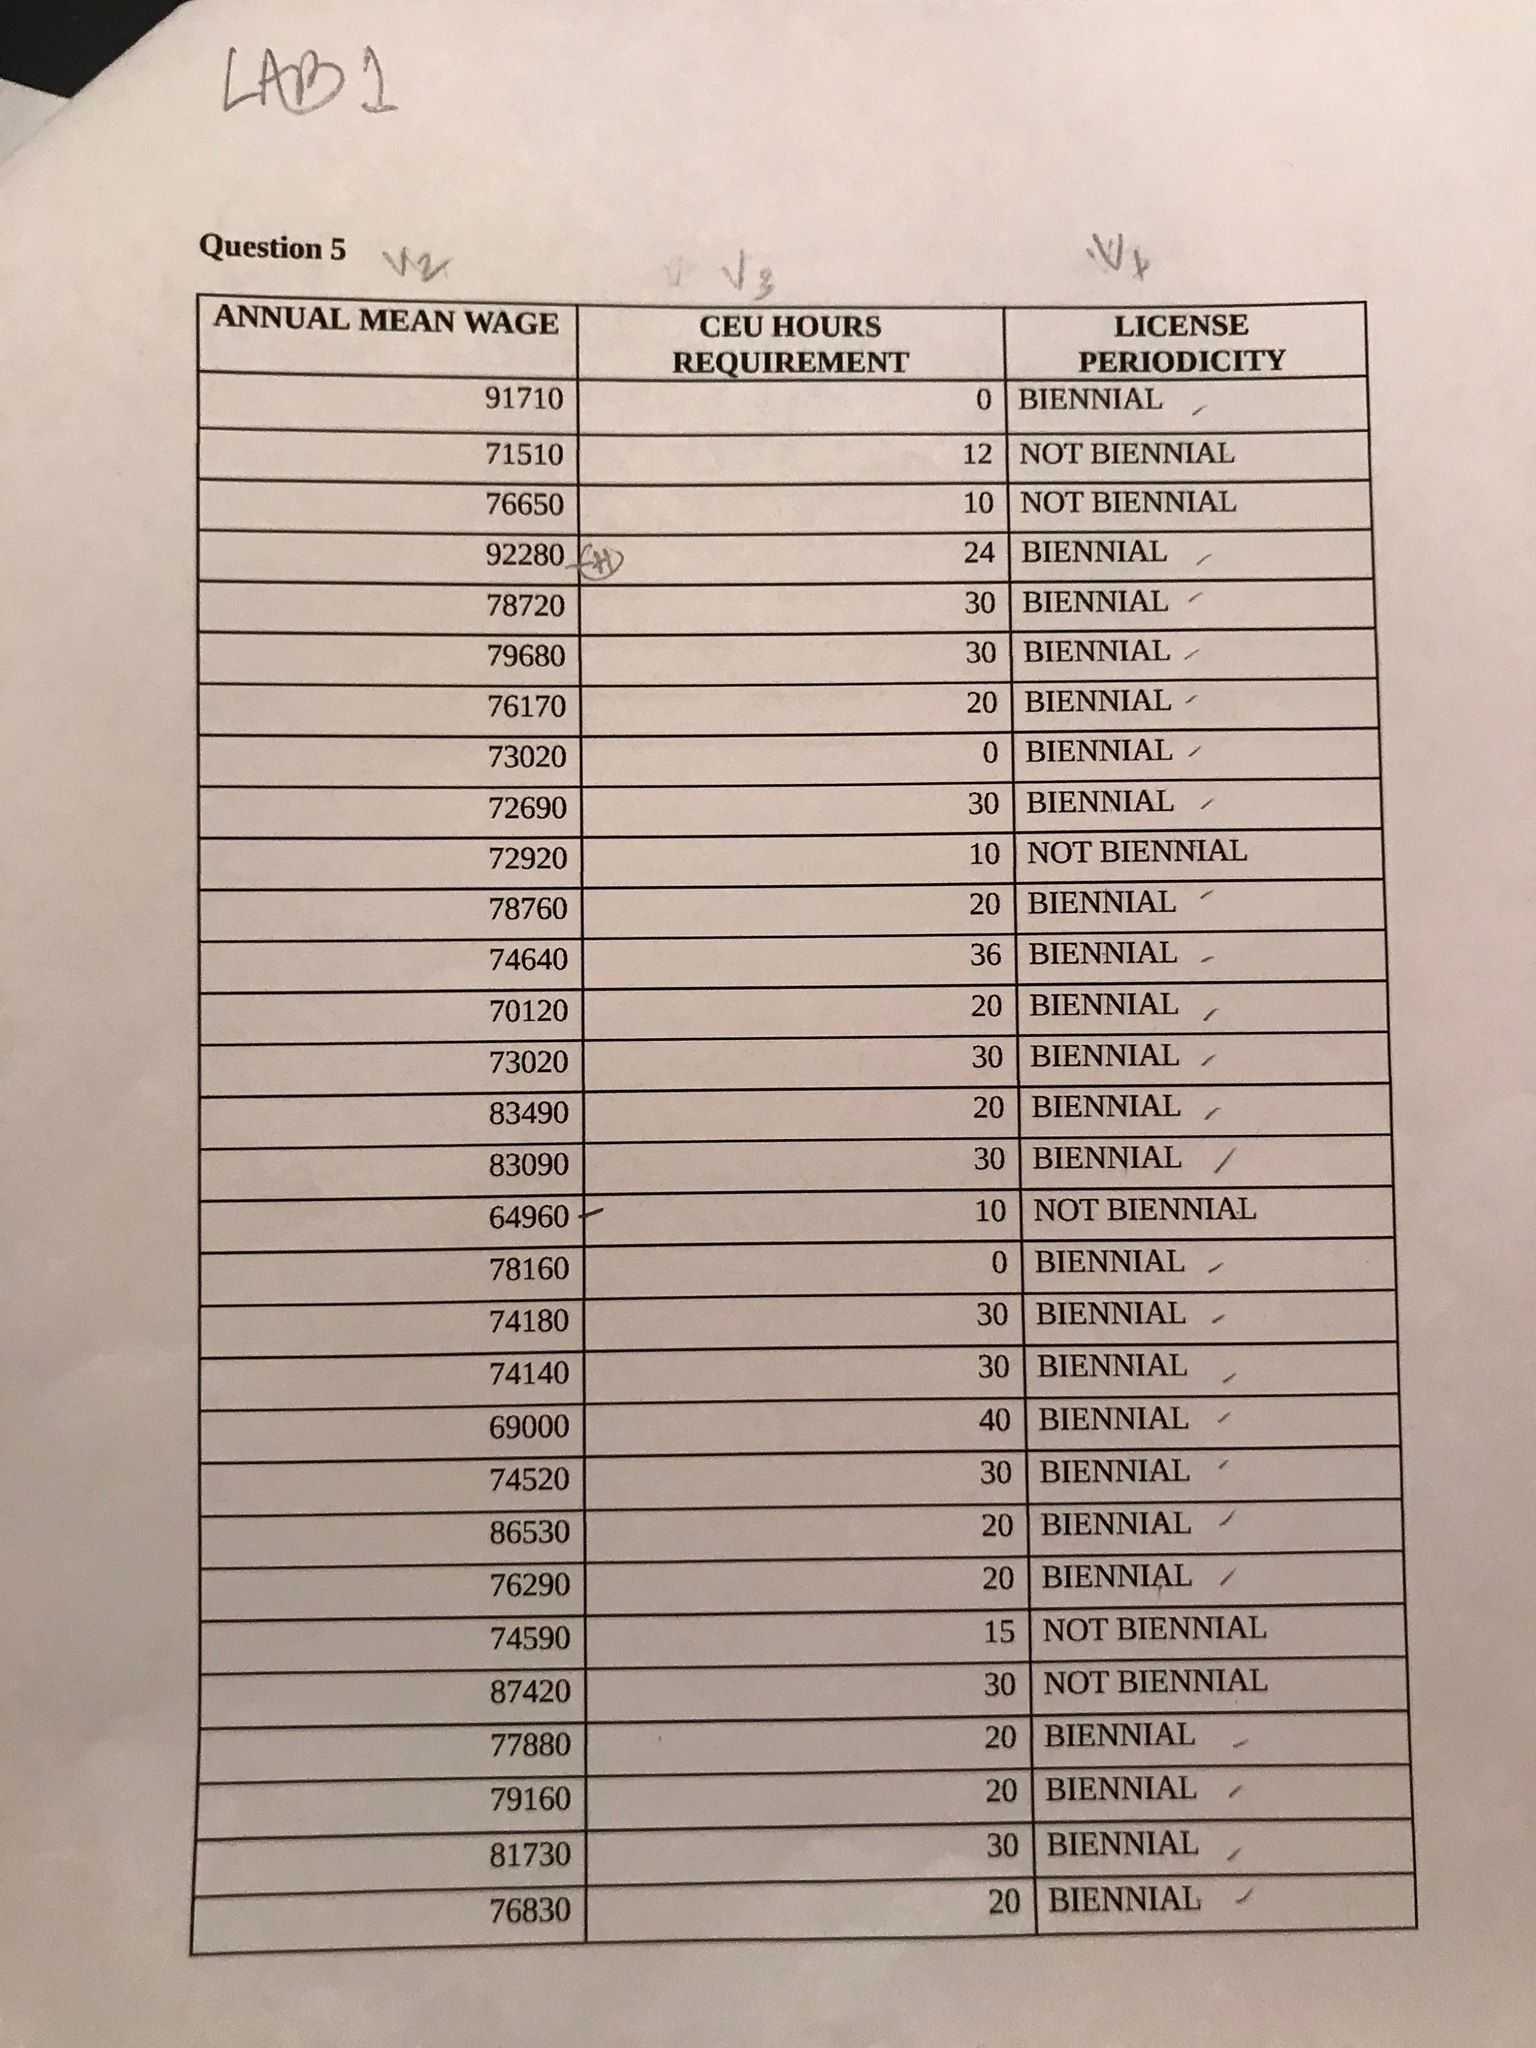
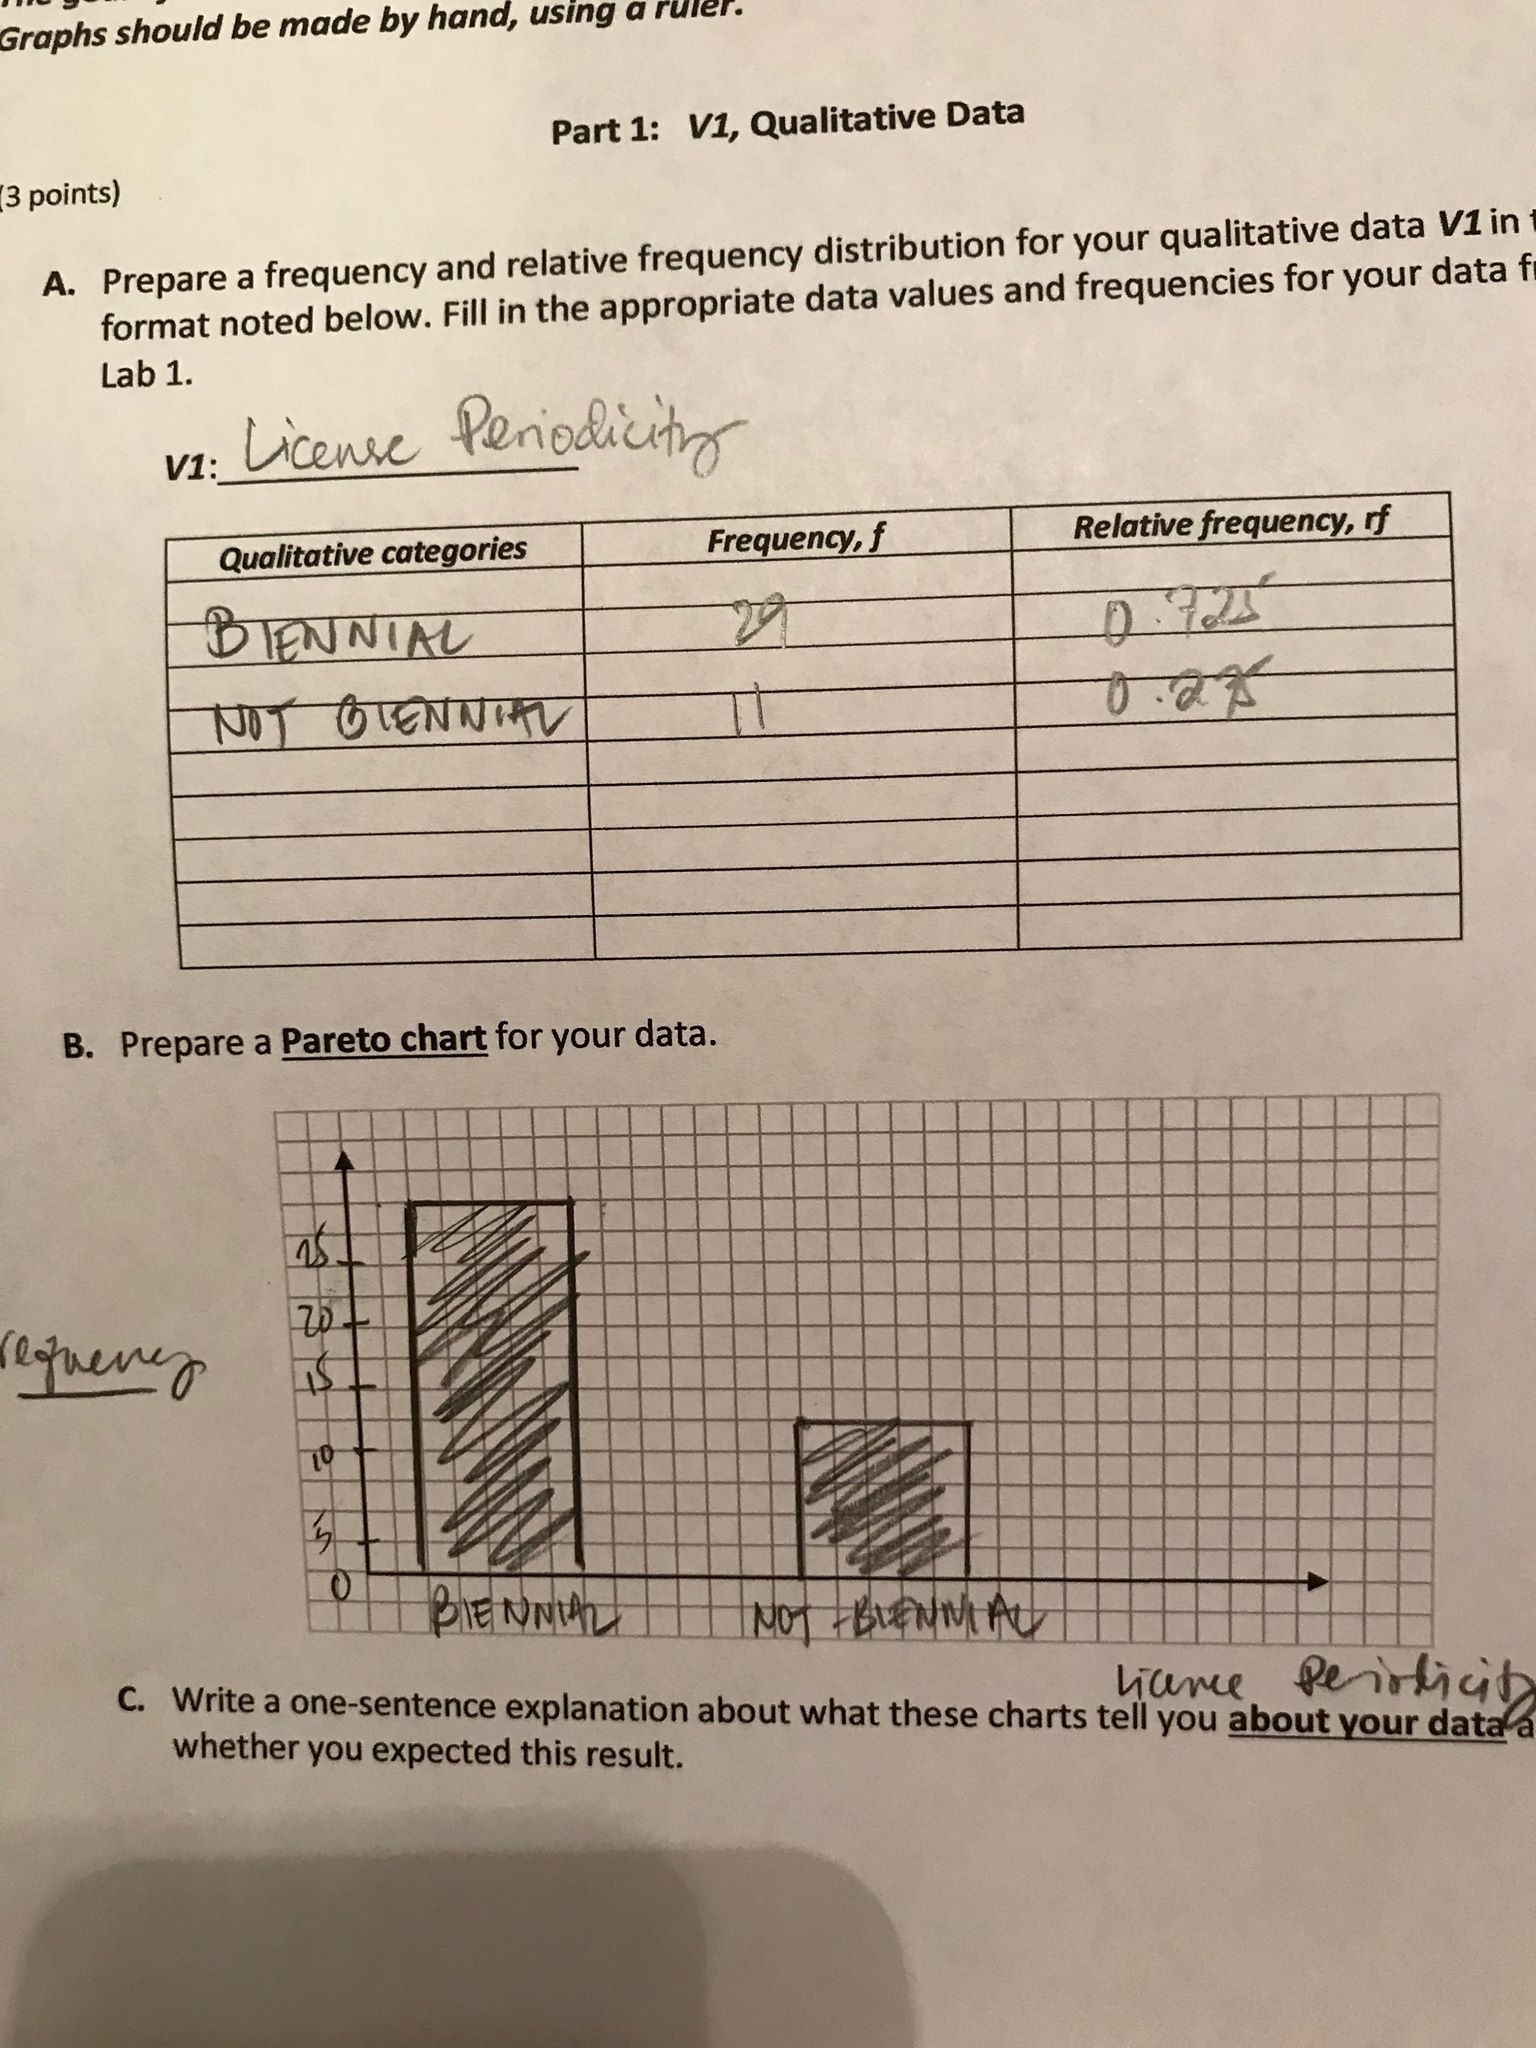
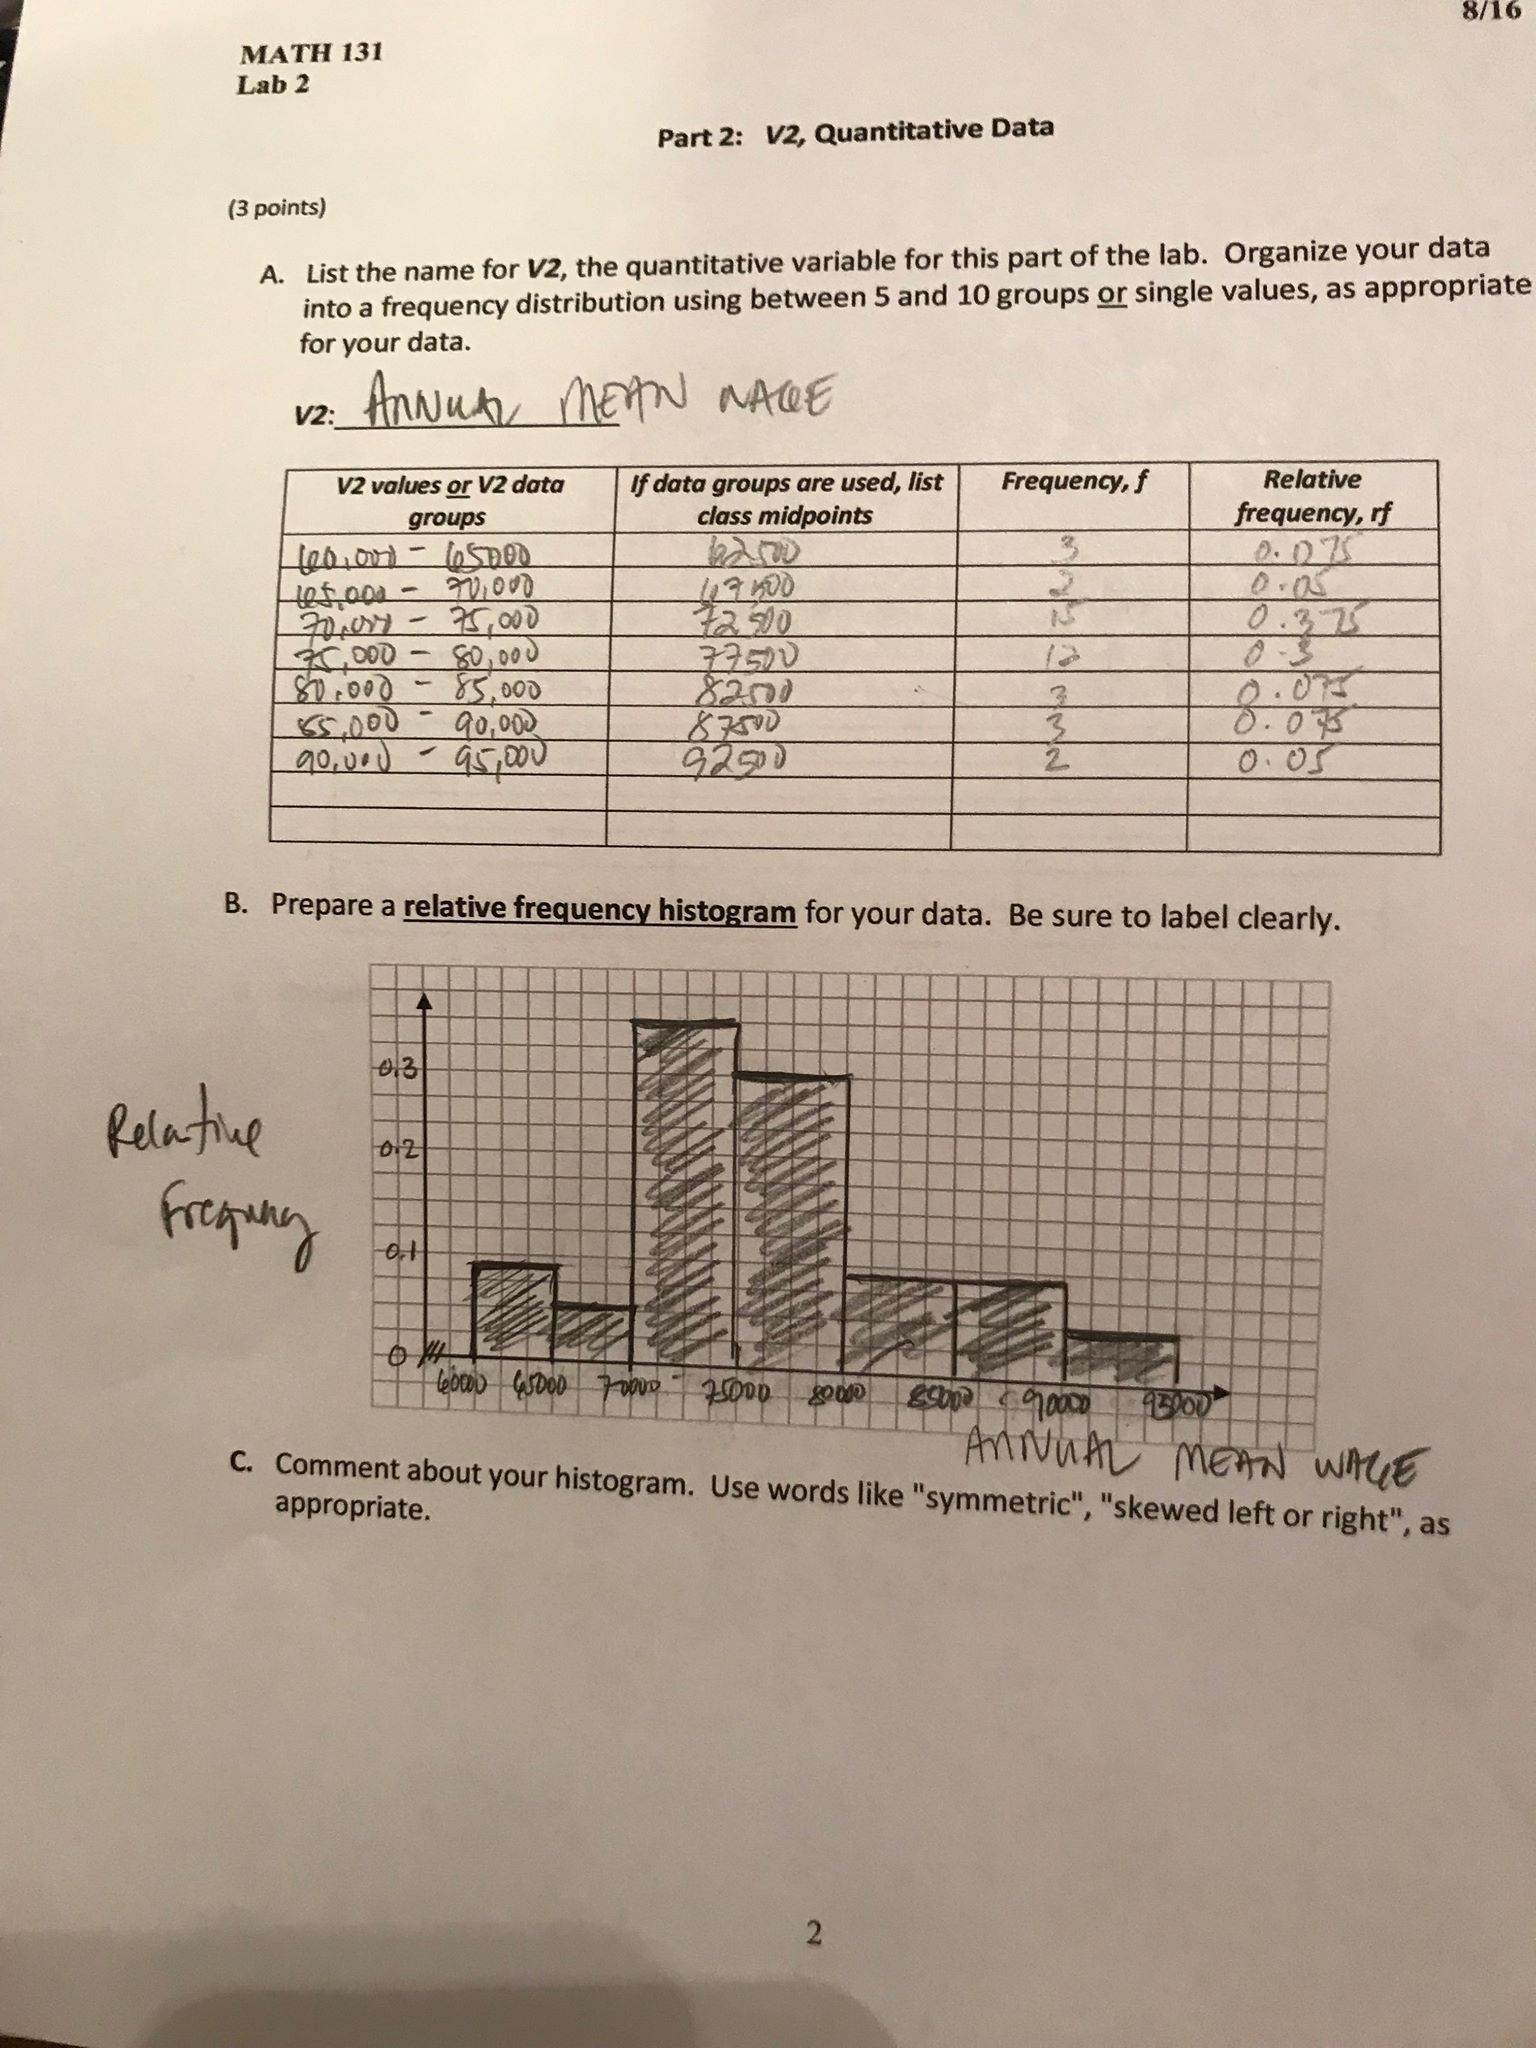
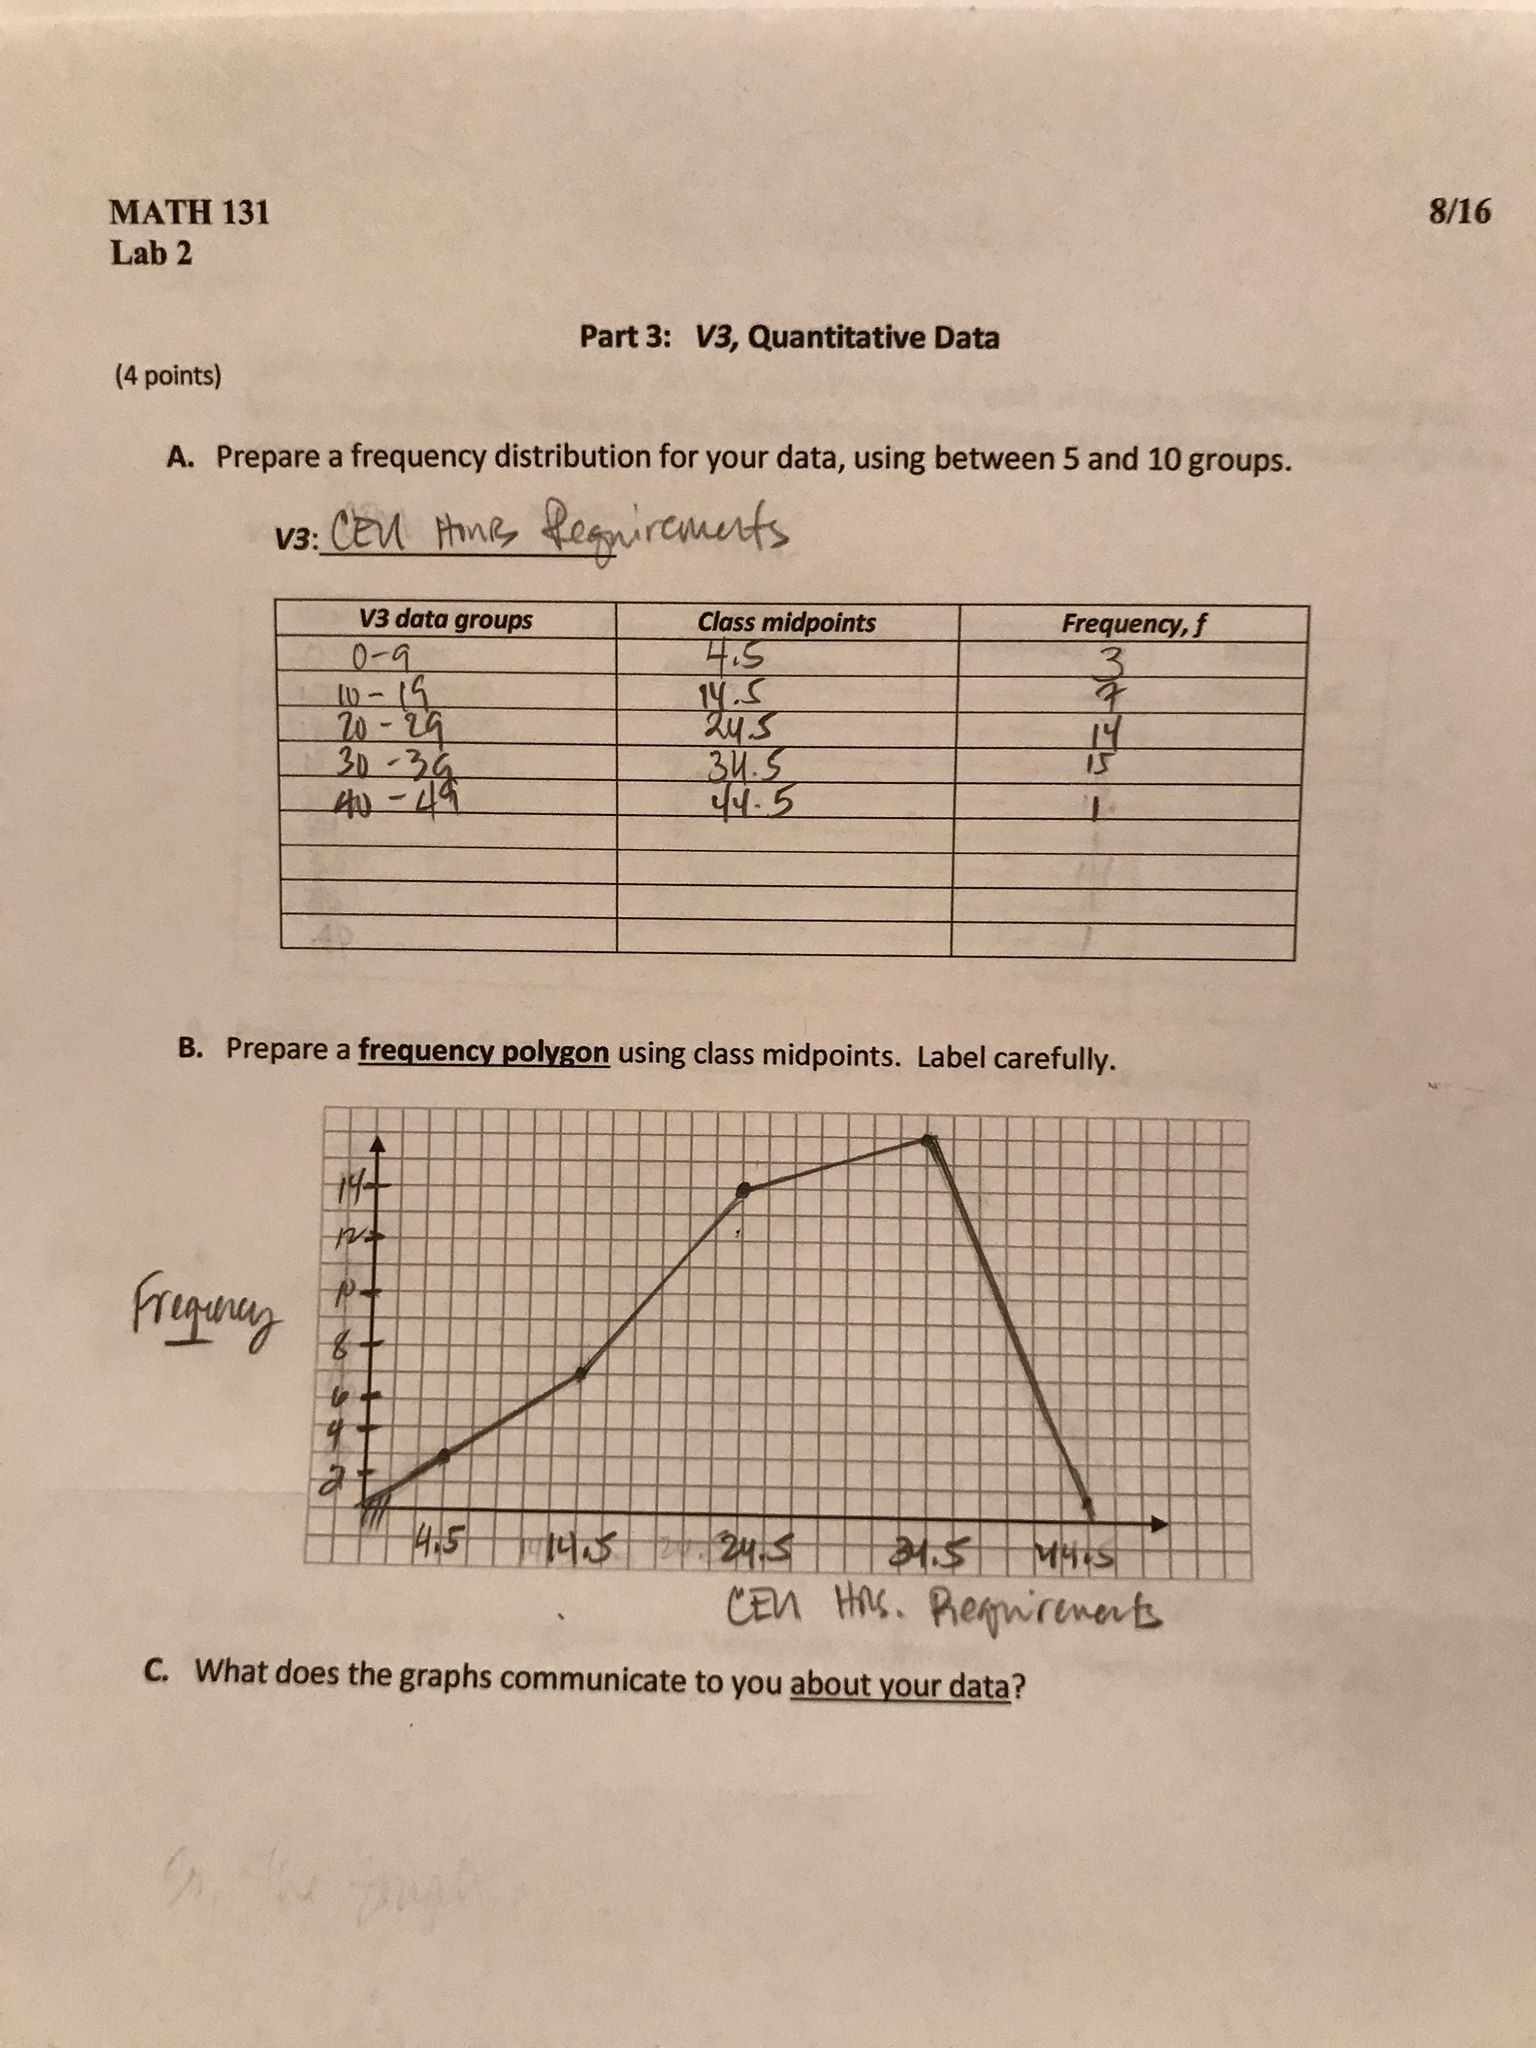
LAMBI can't 77690 20 | BIENNIAL 60030_ 30 | NOT BIENNIAL 74920 | NOT BIENNIAL 71830 20 | BIENNIAL 852 20 30 | BIENNIAL 74160 30 | NOT BIENNIAL 76110 30 | NOT BIENNIAL 68950 20| BIENNIAL 61780 20 \\BIENNIAL 74340 12| NOT BIENNIALLAB 1 Question 5 V 8 ANNUAL MEAN WAGE CEU HOURS LICENSE REQUIREMENT* PERIODICITY* 91710 O | BIENNIAL 71510 12| NOT BIENNIAL 76650 10| NOT BIENNIAL 92280. [_XD) 24| BIENNIAL 78720 30| BIENNIAL 79680 30 | BIENNIAL 76170 20| BIENNIAL 73020 O | BIENNIAL 72690 30| BIENNIAL 72920 10 | NOT BIENNIAL 78760 20| BIENNIAL 74640 36| BIENNIAL 70120 20| BIENNIAL 73020 30 \\BIENNIAL 83490 20 | BIENNIAL 8:3090 30 | BIENNIAL 6:4960 10 | NOT BIENNIAL 78160 O | BIENNIAL 74180 30 | BIENNIAL 74140 30 | BIENNIAL 69000 40| BIENNIAL 74520 30| BIENNIAL 86530 20 | BIENNIAL 76290 20| BIENNIAL 74590 15\\ NOT BIENNIAL 87420 30 | NOT BIENNIAL 77880 20 | BIENNIAL 79160 20 | BIENNIAL\\ 81730 30 \\BIENNIAL 768:30 20| BIENNIALGraphs should be made by hand , using al Part 1 : V1 , Qualitative Data 13 points ) A. Prepare a frequency and relative frequency distribution for your qualitative data VI in format noted below . Fill in the appropriate data values and frequencies for your data$ Lab 1 . vz : License Periodicity Qualitative categories Frequency , I Relative frequency , If BIENNIAL NOT OVENNIAV B. Prepare a Pareto chart for your data . 25 . required 20 BIENNIAL NOT + BIENNIAL | | | Viance periodicity C. Write a one-sentence explanation about what these charts tell you about your datara whether you expected this result .MATH 131 Lab 2 Part 2 : VZ , Quantitative Data ( 3 points ) A. List the name for VZ , the quantitative variable for this part of the lab . Organize your data into a frequency distribution using between 5 and 10 groups or single values , as appropriate for your data . V2 : ANNUAL MEAN NAGLE V Z values or V Z data If data groups are used , list Frequency , } Relative groups class midpoints frequency , If tel, out - 6050 00 0 . 07 tefood - 70, 000 427 500 O . Os FROM1 - 75, 000 70, 000 - 80, 000 7 2. 500 0 . 3- 75% 7 750 0 0 - 3 80,000 - 85, 000 12 55,000 - 90, 00 0 $2500 0 . 07 90 , 010 - 95,00 0 8 7500 0 . 0 45 9250 0) 0 . US B. Prepare a relative frequency histogram for your data . Be sure to label clearly . $1 3 Relative -0. 2 Frezing \\62,000D\\ 4.5000| 7 70010_| 750 0D\\ 800 $^\\ 850 - 910 1 930 0 0)^ ANNUAL MEAN WALLET C. Comment about your histogram . Use words like " symmetric " , " skewed left or right " , as appropriate . 2MATH 131 8/16 Lab 2 Part 3 : V3 , Quantitative Data ( 4 points) A. Prepare a frequency distribution for your data , using between 5 and 10 groups V3 : CEU Hong, Requirements V3 data groups Class midpoints Frequency , $ 0 - 9 HIS t 10 - 15 20 - 29 14. 5 24.3 30 - 39 34.5 4/4. 5 B. Prepare a frequency polygon using class midpoints . Label carefully . Frequency CEN Has. Requirements C . What does the graphs communicate to you about your data ?"
