 Language is in python
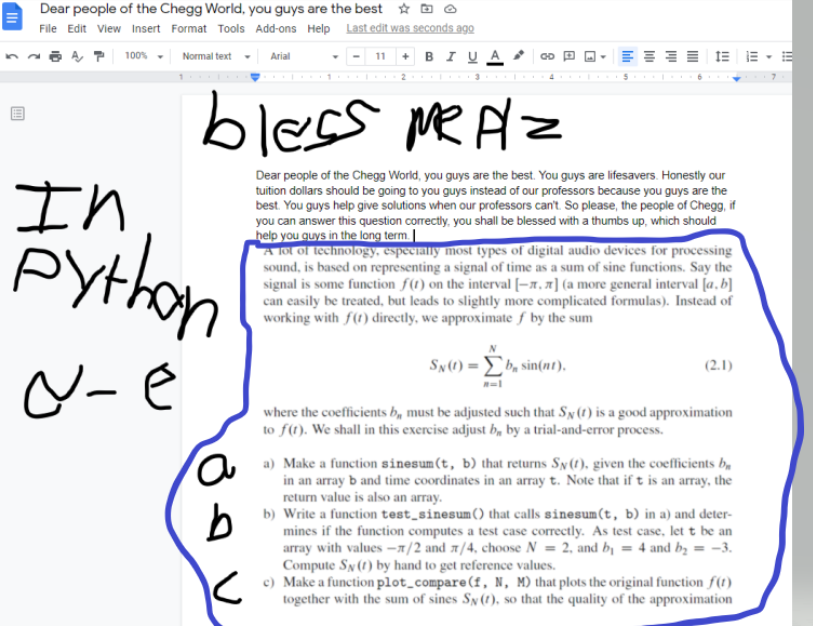
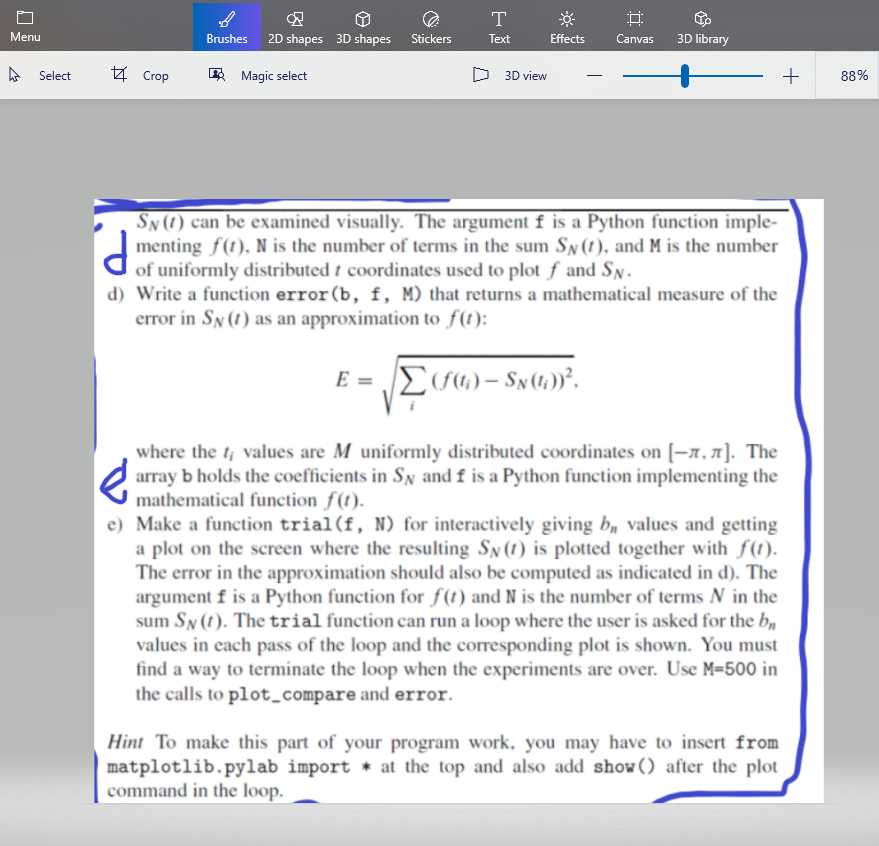
Dear people of the Chegg World, you guys are the best File Edit View Insert Format Tools Add-ons Help Last edit was seconds ago , 100%. Normal text 11 + BILA Arial IEE bless me Az In Bythan Dear people of the Chegg World, you guys are the best. You guys are lifesavers. Honestly our tuition dollars should be going to you guys instead of our professors because you guys are the best. You guys help give solutions when our professors can't. So please, the people of Chegg, if you can answer this question correctly, you shall be blessed with a thumbs up, which should help you guys in the long term. A lot of technology, especially most types of digital audio devices for processing sound, is based on representing a signal of time as a sum of sine functions. Say the signal is some function f() on the interval [-2.] (a more general interval [a,b] can easily be treated, but leads to slightly more complicated formulas). Instead of working with f(t) directly, we approximate f by the sum Sy(t) = sin(nt). (2.1) -e noo where the coefficients b, must be adjusted such that Sy(t) is a good approximation to f(t). We shall in this exercise adjust b, by a trial-and-error process. a) Make a function sinesum(t, b) that returns Sy(t), given the coefficients by in an array b and time coordinates in an array t. Note that if t is an array, the return value is also an array. b) Write a function test sinesum() that calls sinesum(t, b) in a) and deter- mines if the function computes a test case correctly. As test case, lett be an array with values - X/2 and A/4, choose N = 2, and b. = 4 and b2 = -3. Compute Sn() by hand to get reference values. c) Make a function plot_compare (f, N, M) that plots the original function f(t) together with the sum of sines Sy(t), so that the quality of the approximation T Text Menu Brushes 2D shapes 3D shapes Stickers Effects Canvas 3D library Select 4 Crop Magic select 3D view + 88% d Sy() can be examined visually. The argument f is a Python function imple- menting f(t), N is the number of terms in the sum Sn(t), and M is the number of uniformly distributed t coordinates used to plot f and Sy. d) Write a function error(b, f, M) that returns a mathematical measure of the error in Sy(t) as an approximation to f(t): E = {(f(ti) Sv (t:))?, ? V where the t; values are M uniformly distributed coordinates on (-1,1). The array b holds the coefficients in Sy and f is a Python function implementing the mathematical function fo). e) Make a function trial(f, N) for interactively giving by values and getting a plot on the screen where the resulting Sy(t) is plotted together with f(). The error in the approximation should also be computed as indicated in d). The argument f is a Python function for f(t) and N is the number of terms N in the sum Sy(t). The trial function can run a loop where the user is asked for the bn values in each pass of the loop and the corresponding plot is shown. You must find a way to terminate the loop when the experiments are over. Use M=500 in the calls to plot_compare and error. Hint To make this part of your program work, you may have to insert from matplotlib.pylab import * at the top and also add show() after the plot command in the loop. Dear people of the Chegg World, you guys are the best File Edit View Insert Format Tools Add-ons Help Last edit was seconds ago , 100%. Normal text 11 + BILA Arial IEE bless me Az In Bythan Dear people of the Chegg World, you guys are the best. You guys are lifesavers. Honestly our tuition dollars should be going to you guys instead of our professors because you guys are the best. You guys help give solutions when our professors can't. So please, the people of Chegg, if you can answer this question correctly, you shall be blessed with a thumbs up, which should help you guys in the long term. A lot of technology, especially most types of digital audio devices for processing sound, is based on representing a signal of time as a sum of sine functions. Say the signal is some function f() on the interval [-2.] (a more general interval [a,b] can easily be treated, but leads to slightly more complicated formulas). Instead of working with f(t) directly, we approximate f by the sum Sy(t) = sin(nt). (2.1) -e noo where the coefficients b, must be adjusted such that Sy(t) is a good approximation to f(t). We shall in this exercise adjust b, by a trial-and-error process. a) Make a function sinesum(t, b) that returns Sy(t), given the coefficients by in an array b and time coordinates in an array t. Note that if t is an array, the return value is also an array. b) Write a function test sinesum() that calls sinesum(t, b) in a) and deter- mines if the function computes a test case correctly. As test case, lett be an array with values - X/2 and A/4, choose N = 2, and b. = 4 and b2 = -3. Compute Sn() by hand to get reference values. c) Make a function plot_compare (f, N, M) that plots the original function f(t) together with the sum of sines Sy(t), so that the quality of the approximation T Text Menu Brushes 2D shapes 3D shapes Stickers Effects Canvas 3D library Select 4 Crop Magic select 3D view + 88% d Sy() can be examined visually. The argument f is a Python function imple- menting f(t), N is the number of terms in the sum Sn(t), and M is the number of uniformly distributed t coordinates used to plot f and Sy. d) Write a function error(b, f, M) that returns a mathematical measure of the error in Sy(t) as an approximation to f(t): E = {(f(ti) Sv (t:))?, ? V where the t; values are M uniformly distributed coordinates on (-1,1). The array b holds the coefficients in Sy and f is a Python function implementing the mathematical function fo). e) Make a function trial(f, N) for interactively giving by values and getting a plot on the screen where the resulting Sy(t) is plotted together with f(). The error in the approximation should also be computed as indicated in d). The argument f is a Python function for f(t) and N is the number of terms N in the sum Sy(t). The trial function can run a loop where the user is asked for the bn values in each pass of the loop and the corresponding plot is shown. You must find a way to terminate the loop when the experiments are over. Use M=500 in the calls to plot_compare and error. Hint To make this part of your program work, you may have to insert from matplotlib.pylab import * at the top and also add show() after the plot command in the loop

 Language is in python


