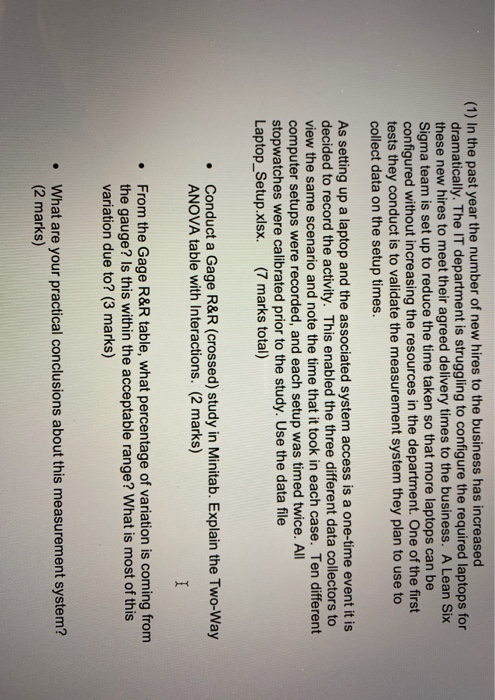
Laptopid 45PML 69PML 12PML PRINS 6 ORINS 1 ZYRT 19YRT 9 1YRT 10 ZYRT 11 SRSDT 12 JASPML 13 PML 14 72PML INS SINS 17 1.2YRT 18 19YRT 19 1YRT 20 ZYRT 1 SDT 22 SPML DataColled 259 Doug 242 Doug 256 Doug 310 Doug 315 Doug 69 DOME 62 Doug Doug 67 Doug 260 Doug 261 Doug 243 Doug 256 Doug 310 DONE - 314 Doug 70 Doug 50 Dout 58 Doug 68 Doug 262 Doug 291 Jess - 23 PM 274 less Page 1 ---- ----- 2472PML 25 78INS 26 SINS 27 12YRT 28 J19YRT 29 121YRT 30 22YRT 31 SRSDT 32 45PML 169PML 472PML 35 SINS 36 138INS 37 12YRT 38 19YRT 39 21YRT 40 ZYRT SOT 45PML 16/9PML 12PML 2RS Jess 340 Jess 343 less 101 Jess 88 less 79 less 98 Jess 291 Jess 292 Jess 274 Jess 285 Jess 341 Jess 343 Jess 101 less 79 less 79 less 98 less 292 Jess 259 Ana 242 Ana 254 Ana 310 Ana 315 Ana 71 Ana 52. Ana 59 Ana 67 Ana 261 Ana 260 Ana 242 Ana 254 Ana 311 Ana 315 Ana 71 Ana 64 Ana 59 Ana 69 Ana 261 Ana INS INS 12YRT 21YRT ----- - 52 2ZYRT 5RSDT SPML SPML 54 PML 55 PINS AINS 57 12YRT SR 19YRT 59 21YRT GERT 61 SESOT (1) In the past year the number of new hires to the business has increased dramatically. The IT department is struggling to configure the required laptops for these new hires to meet their agreed delivery times to the business. A Lean Six Sigma team is set up to reduce the time taken so that more laptops can be configured without increasing the resources in the department. One of the first tests they conduct is to validate the measurement system they plan to use to collect data on the setup times. As setting up a laptop and the associated system access is a one-time event it is decided to record the activity. This enabled the three different data collectors to view the same scenario and note the time that it took in each case. Ten different computer setups were recorded, and each setup was timed twice. All stopwatches were calibrated prior to the study. Use the data file Laptop_Setup.xlsx. (7 marks total) Conduct a Gage R&R (crossed) study in Minitab. Explain the Two-Way ANOVA table with Interactions. (2 marks) From the Gage R&R table, what percentage of variation is coming from the gauge? Is this within the acceptable range? What is most of this variation due to? (3 marks) What are your practical conclusions about this measurement system? (2 marks) Laptopid 45PML 69PML 12PML PRINS 6 ORINS 1 ZYRT 19YRT 9 1YRT 10 ZYRT 11 SRSDT 12 JASPML 13 PML 14 72PML INS SINS 17 1.2YRT 18 19YRT 19 1YRT 20 ZYRT 1 SDT 22 SPML DataColled 259 Doug 242 Doug 256 Doug 310 Doug 315 Doug 69 DOME 62 Doug Doug 67 Doug 260 Doug 261 Doug 243 Doug 256 Doug 310 DONE - 314 Doug 70 Doug 50 Dout 58 Doug 68 Doug 262 Doug 291 Jess - 23 PM 274 less Page 1 ---- ----- 2472PML 25 78INS 26 SINS 27 12YRT 28 J19YRT 29 121YRT 30 22YRT 31 SRSDT 32 45PML 169PML 472PML 35 SINS 36 138INS 37 12YRT 38 19YRT 39 21YRT 40 ZYRT SOT 45PML 16/9PML 12PML 2RS Jess 340 Jess 343 less 101 Jess 88 less 79 less 98 Jess 291 Jess 292 Jess 274 Jess 285 Jess 341 Jess 343 Jess 101 less 79 less 79 less 98 less 292 Jess 259 Ana 242 Ana 254 Ana 310 Ana 315 Ana 71 Ana 52. Ana 59 Ana 67 Ana 261 Ana 260 Ana 242 Ana 254 Ana 311 Ana 315 Ana 71 Ana 64 Ana 59 Ana 69 Ana 261 Ana INS INS 12YRT 21YRT ----- - 52 2ZYRT 5RSDT SPML SPML 54 PML 55 PINS AINS 57 12YRT SR 19YRT 59 21YRT GERT 61 SESOT (1) In the past year the number of new hires to the business has increased dramatically. The IT department is struggling to configure the required laptops for these new hires to meet their agreed delivery times to the business. A Lean Six Sigma team is set up to reduce the time taken so that more laptops can be configured without increasing the resources in the department. One of the first tests they conduct is to validate the measurement system they plan to use to collect data on the setup times. As setting up a laptop and the associated system access is a one-time event it is decided to record the activity. This enabled the three different data collectors to view the same scenario and note the time that it took in each case. Ten different computer setups were recorded, and each setup was timed twice. All stopwatches were calibrated prior to the study. Use the data file Laptop_Setup.xlsx. (7 marks total) Conduct a Gage R&R (crossed) study in Minitab. Explain the Two-Way ANOVA table with Interactions. (2 marks) From the Gage R&R table, what percentage of variation is coming from the gauge? Is this within the acceptable range? What is most of this variation due to? (3 marks) What are your practical conclusions about this measurement system? (2 marks)


