Answered step by step
Verified Expert Solution
Link Copied!

Question

1 Approved Answer

LAS # 130 SAS 120 Price level (GDP deflator, 2009 = 100F 110 X 100 90 AD O 170 17.5 18.0 18.5 19.0 19.5 Real
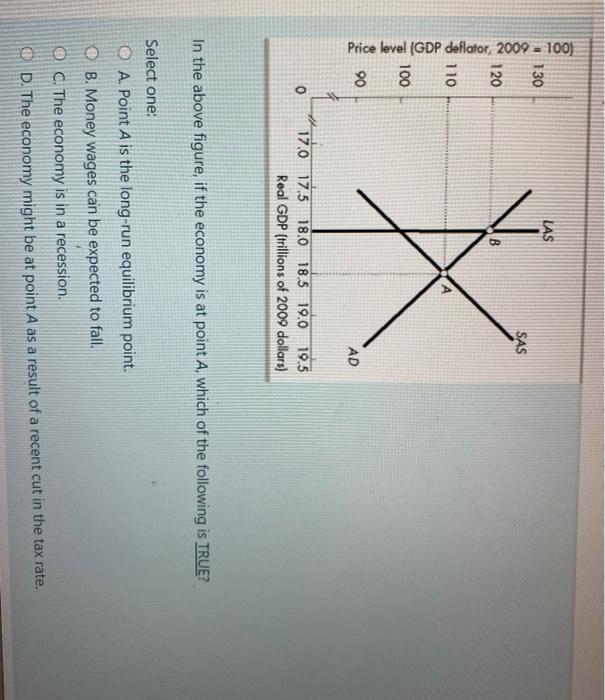
image text in transcribed
LAS # 130 SAS 120 Price level (GDP deflator, 2009 = 100F 110 X 100 90 AD O 170 17.5 18.0 18.5 19.0 19.5 Real GDP (trillions of 2009 dollars) In the above figure, if the economy is at point A, which of the following is TRUE? Select one: O A. Point A is the long-run equilibrium point. O B. Money wages can be expected to fall. O C. The economy is in a recession. OD. The economy might be at point A as a result of a recent cut in the tax rate

Step by Step Solution

There are 3 Steps involved in it

Step: 1

blur-text-image

Get Instant Access to Expert-Tailored Solutions

See step-by-step solutions with expert insights and AI powered tools for academic success

Step: 2

blur-text-image

Step: 3

blur-text-image

Ace Your Homework with AI

Get the answers you need in no time with our AI-driven, step-by-step assistance

Get Started

Recommended Textbook for

Essentials Of Applied Econometrics

Authors: Aaron D Smith, J Edward Taylor

1st Edition

0520288335, 9780520288331

More Books

Students also viewed these Economics questions

Question

demonstrate the importance of induction training.

Answered: 1 week ago