Answered step by step
Verified Expert Solution
Link Copied!

Question

1 Approved Answer

lased on the data provided, carry out the following analyses: * Plot the concentration-response relationships for all three drugs in the in vitro CYP209 enzyme
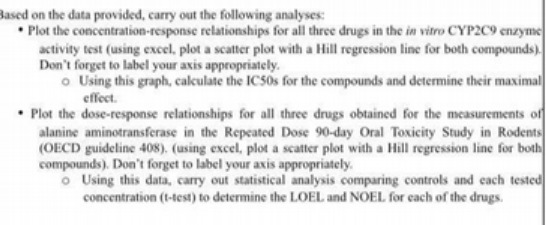
image text in transcribed
lased on the data provided, carry out the following analyses: * Plot the concentration-response relationships for all three drugs in the in vitro CYP209 enzyme activity test (using excel, plot a scatter plot with a Hill regression line for both compounds). Don't forget to label your axis appropriately. o Using this graph, calculate the IC50s for the compounds and determine their maximal effect. * Plot the dose-response relationships for all three drugs obtained for the measurements of alanine aminotransferase in the Repeated Dose 90-day Oral Toxicity Study in Rodents (OECD guideline 408). (using excel, plot a scatter plot with a Hill regression line for both compounds). Don't forget to label your axis appropriately. o Using this data, carry out statistical analysis comparing controls and each tested concentration (1-test) to determine the LOEL and NOEL for each of the drugs

Step by Step Solution

There are 3 Steps involved in it

Step: 1

blur-text-image

Get Instant Access to Expert-Tailored Solutions

See step-by-step solutions with expert insights and AI powered tools for academic success

Step: 2

blur-text-image

Step: 3

blur-text-image

Ace Your Homework with AI

Get the answers you need in no time with our AI-driven, step-by-step assistance

Get Started

Recommended Textbook for

Elementary Statisitcs

Authors: Barry Monk

2nd edition

1259345297, 978-0077836351, 77836359, 978-1259295911, 1259295915, 978-1259292484, 1259292487, 978-1259345296

More Books

Students also viewed these Mathematics questions

Question

2. Outline the guidelines for developing a good brand portfolio.

Answered: 1 week ago

Question

Which hyperparameters exist in a basic MLP ?

Answered: 1 week ago