Answered step by step
Verified Expert Solution
Question
1 Approved Answer
last attempt please help Hurricanes Katrina and Rita caused the flooding of large parts of New Orleans, leaving behind large amounts of new sediment. Before
last attempt please help
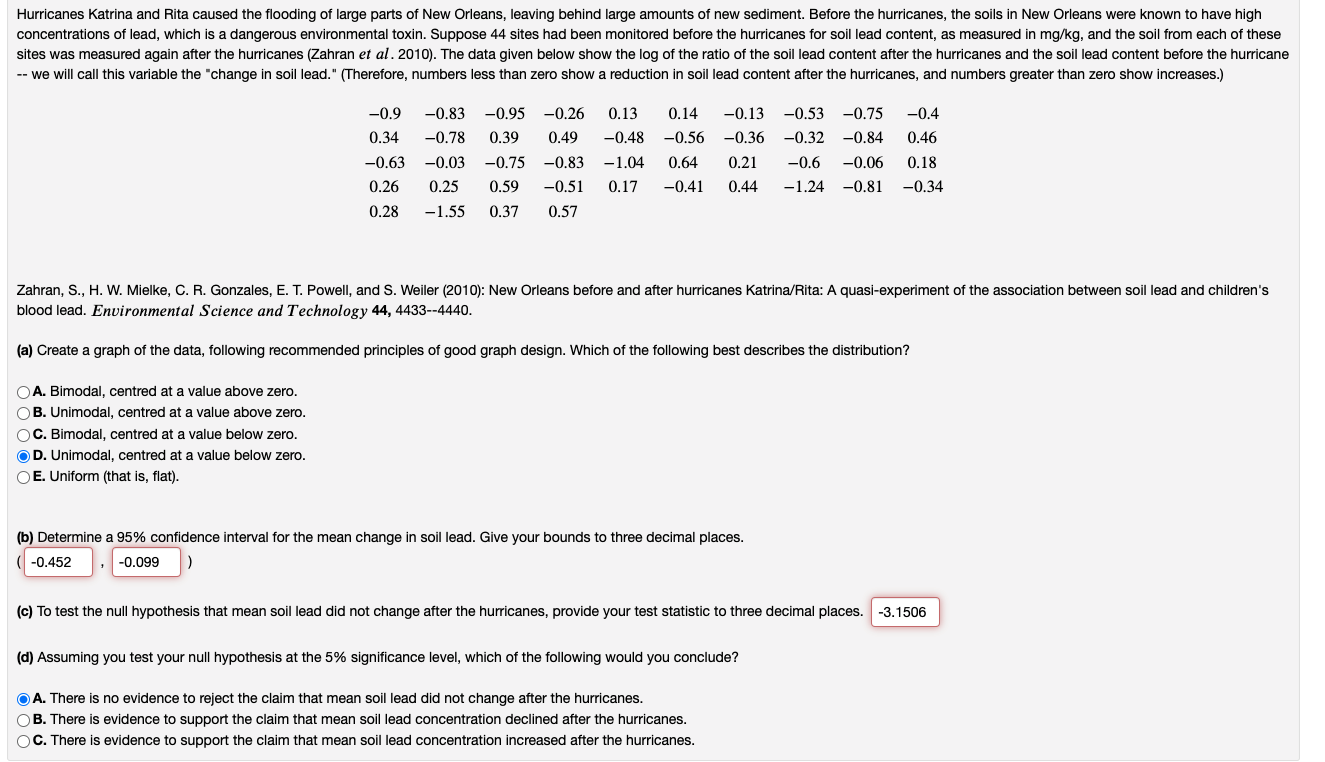
 Hurricanes Katrina and Rita caused the flooding of large parts of New Orleans, leaving behind large amounts of new sediment. Before the hurricanes, the soils in New Orleans were known to have high concentrations of lead, which is a dangerous environmental toxin. Suppose 44 sites had been monitored before the hurricanes for soil lead content, as measured in mg/kg, and the soil from each of these sites was measured again after the hurricanes (Zahran et al. 2010). The data given below show the log of the ratio of the soil lead content after the hurricanes and the soil lead content before the hurricane -- we will call this variable the "change in soil lead." (Therefore, numbers less than zero show a reduction in soil lead content after the hurricanes, and numbers greater than zero show increases.) -0.9 -0.83 -0.95 -0.26 0.13 0.14 -0.13 -0.53 -0.75 -0.4 0.34 -0.78 0.39 0.49 -0.48 -0.56 -0.36 -0.32 -0.84 0.46 -0.63 -0.03 -0.75 -0.83 -1.04 0.64 0.21 -0.6 -0.06 0.18 0.26 0.25 0.59 -0.51 0.17 -0.41 0.44 -1.24 -0.81 -0.34 0.28 -1.55 0.37 0.57 Zahran, S., H. W. Mielke, C. R. Gonzales, E. T. Powell, and S. Weiler (2010): New Orleans before and after hurricanes Katrina/Rita: A quasi-experiment of the association between soil lead and children's blood lead. Environmental Science and Technology 44, 4433--4440. (a) Create a graph of the data, following recommended principles of good graph design. Which of the following best describes the distribution? A. Bimodal, centred at a value above zero. OB. Unimodal, centred at a value above zero. O C. Bimodal, centred at a value below zero. O D. Unimodal, centred at a value below zero. OE. Uniform (that is, flat). (b) Determine a 95% confidence interval for the mean change in soil lead. Give your bounds to three decimal places. ( -0.452 -0.099 (c) To test the null hypothesis that mean soil lead did not change after the hurricanes, provide your test statistic to three decimal places. -3.1506 (d) Assuming you test your null hypothesis at the 5% significance level, which of the following would you conclude? O A. There is no evidence to reject the claim that mean soil lead did not change after the hurricanes. B. There is evidence to support the claim that mean soil lead concentration declined after the hurricanes. C. There is evidence to support the claim that mean soil lead concentration increased after the hurricanes
 Step by Step Solution
There are 3 Steps involved in it
Step: 1

Get Instant Access to Expert-Tailored Solutions
See step-by-step solutions with expert insights and AI powered tools for academic success
Step: 2

Step: 3

Ace Your Homework with AI
Get the answers you need in no time with our AI-driven, step-by-step assistance
Get Started


