Answered step by step
Verified Expert Solution
Question
1 Approved Answer
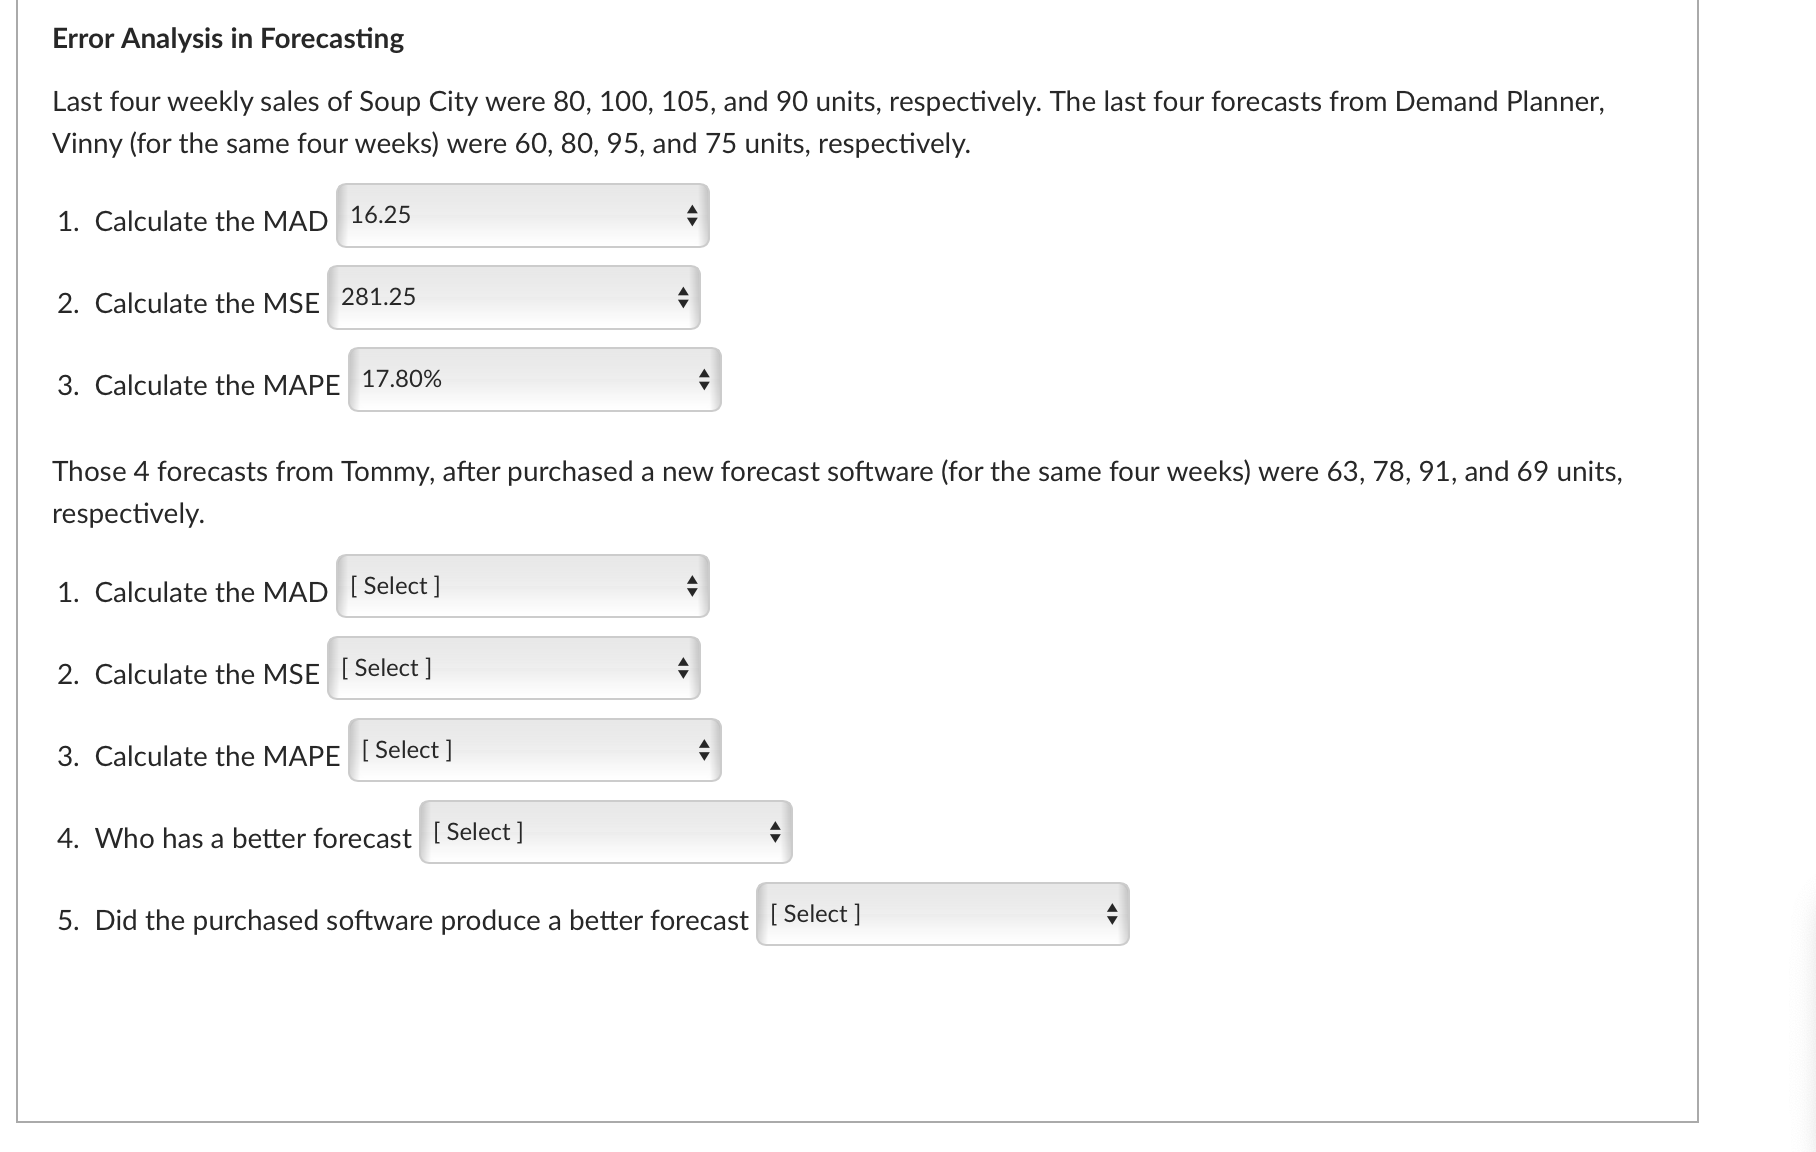
Last four weekly sales of Soup City were 80, 100, 105, and 90 units, respectively. The last four forecasts from Demand Planner, Vinny (for the
 Last four weekly sales of Soup City were 80, 100, 105, and 90 units, respectively. The last four forecasts from Demand Planner, Vinny (for the same four weeks) were 60, 80, 95, and 75 units, respectively. 1. Calculate the MAD 2. Calculate the MSE 3. Calculate the MAPE Those 4 forecasts from Tommy, after purchased a new forecast software (for the same four weeks) were 63, 78, 91, and 69 units, respectively. 1. Calculate the MAD 2. Calculate the MSE 3. Calculate the MAPE 4. Who has a better forecast 5. Did the purchased software produce a better forecast
 Step by Step Solution
There are 3 Steps involved in it
Step: 1

Get Instant Access to Expert-Tailored Solutions
See step-by-step solutions with expert insights and AI powered tools for academic success
Step: 2

Step: 3

Ace Your Homework with AI
Get the answers you need in no time with our AI-driven, step-by-step assistance
Get Started


