

Answered step by step
Verified Expert Solution
Question
1 Approved Answer
Last school year, the student body of a local university consisted of 3 0 % freshmen, 2 4 % sophomores, 2 6 % juniors, and
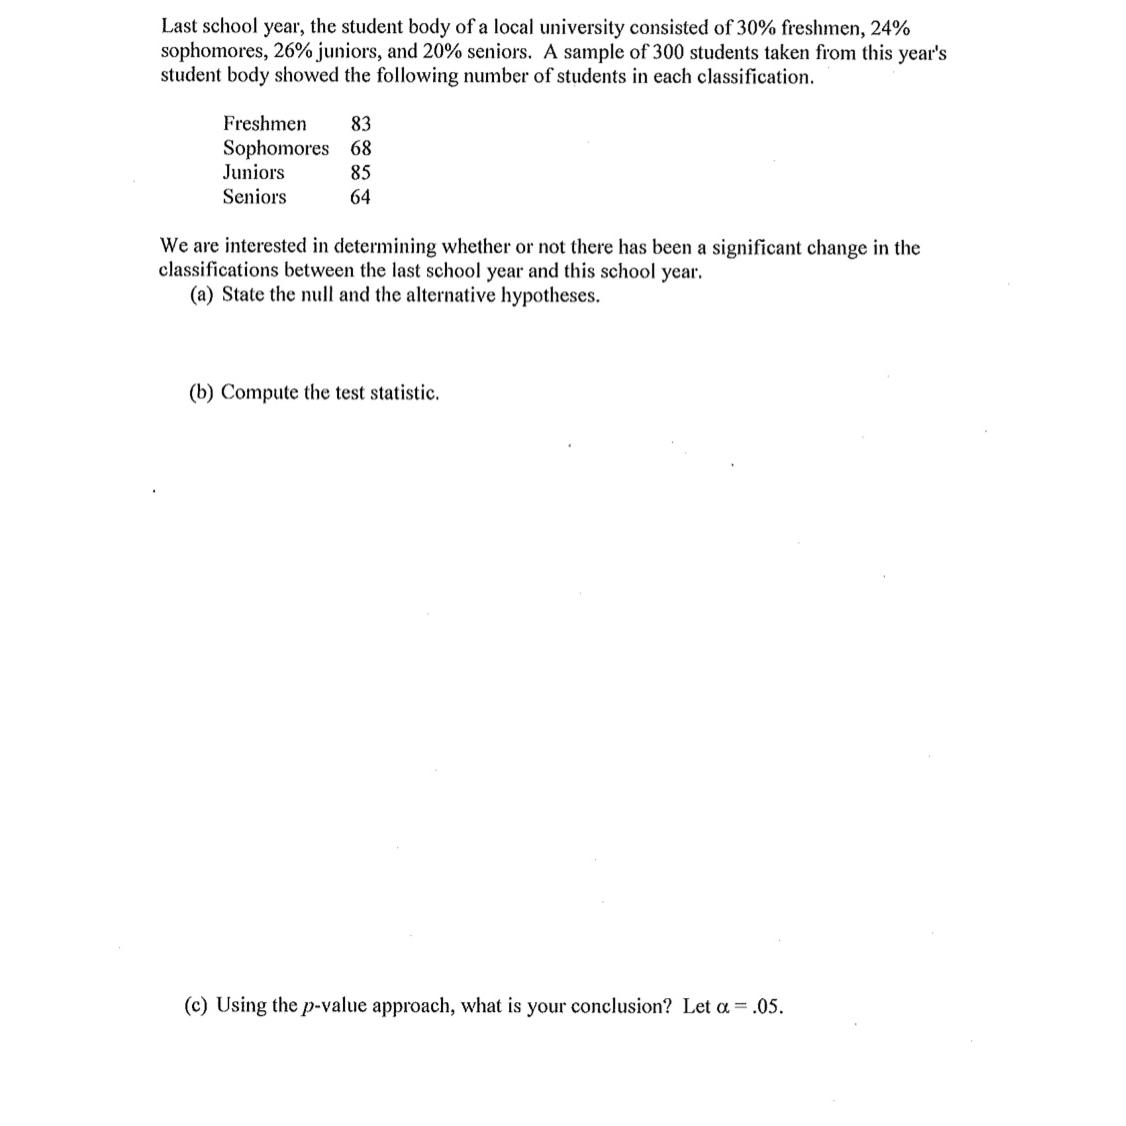
Last school year, the student body of a local university consisted of freshmen, sophomores, juniors, and seniors. A sample of students taken from this year's student body showed the following number of students in each classification.
tableFreshmenSophomoresJuniorsSeniors
We are interested in determining whether or not there has been a significant change in the classifications between the last school year and this school year.
a State the null and the alternative hypotheses.
b Compute the test statistic.
c Using the value approach, what is your conclusion? Let
Step by Step Solution
There are 3 Steps involved in it
Step: 1

Get Instant Access to Expert-Tailored Solutions
See step-by-step solutions with expert insights and AI powered tools for academic success
Step: 2

Step: 3
Ace Your Homework with AI
Get the answers you need in no time with our AI-driven, step-by-step assistance
Get Started
Transportation A Global Supply Chain Perspective
Authors: John J. Coyle, Robert A. Novak, Brian Gibson, Edward J. Bard
8th edition
9781305445352, 1133592961, 130544535X, 978-1133592969