Last set of questions, please help. Willing to pay.
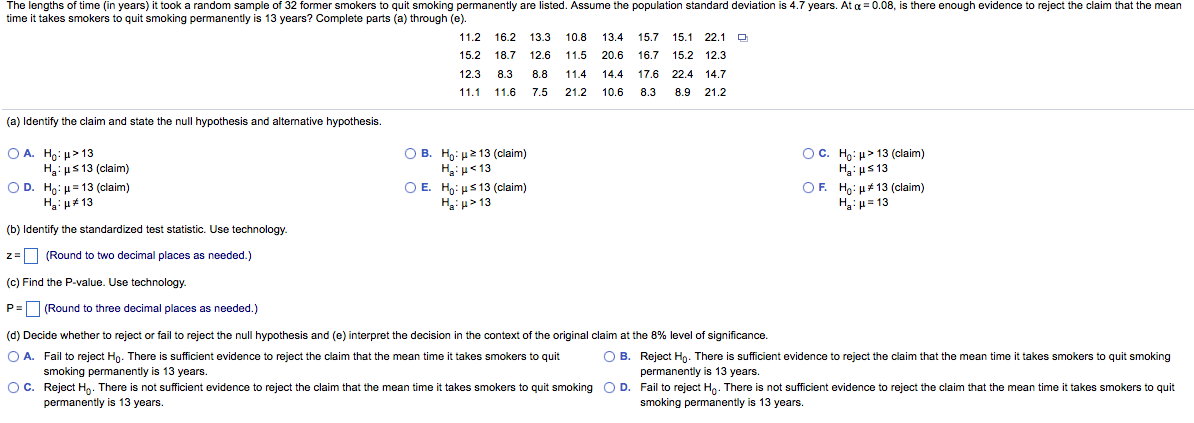
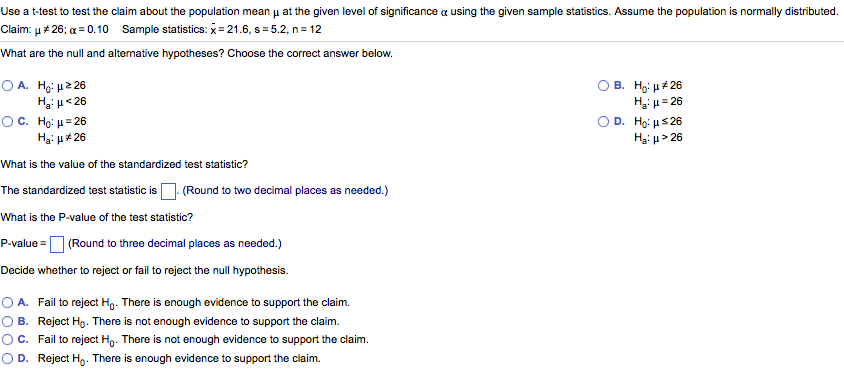
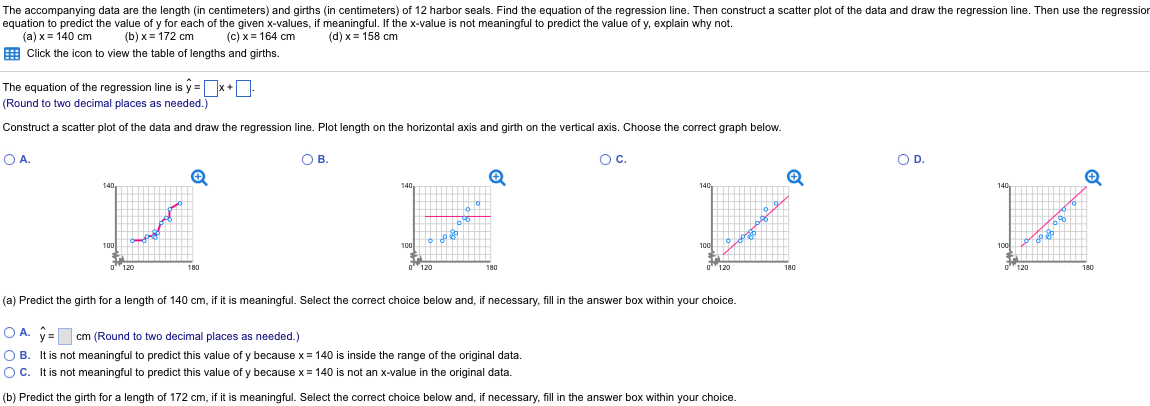
am or adults say (ashews are their favoma klnd of nut. Yhu randomly select 12 adults and ask each In name his or her tamrite nut. Find the pmbahility that the number who sayI mashews are theifavcnln nut Is [a] exam three. [In at least four, and {c} at most two. It convenient. use hechnohgytn nd the probablltlies. [a] Pt31= [Rmrld to Ille nearest Ihweandth as needed.) [b] P(xa4}= [Round tn Ine nearest mwsandth as needed.) (a) PtxsZ) = [Round lathe nearest tmusamdth as needed.) The total cholesterol levels Ufa sample at man aged 35-44 are normally distributed with a mean df210 milligrams per deciliter and a standard deviation at 36.5 miligrarns per deciliter. {a} What percent of the men have a Intel cholesterol larval less than 221 milligrams perdeciliterdf hbod? {b} lf254 men in the 35-44 age group are randomly selected. about how marry would you expect to have a total cholesterol level greater than 255 milligrams perdeciliterdf blood? {a} The percent of the men that have a total cholesterol level lee-e ll'ien 221 milligrams per deciliter 01 blood ls :l'lt. [Round [0 two decimal places as needed.) {b} Of this 254 men sale-med. El would be expected to have a total cholesterol level greaterthan 255 milligrams per deciltsr of blood. [Hound to the nearest integer as needed} The kangths uftlrne [in years] it Ind: a random sample of 32 fun'ner smokers In quit srrnking permanently are lisled. Assume [he imputation standard devlaLion is 4.? years. Al [I = 0.08, is Iliere enumh ewdence Io m'pcl the claim lhal the mean lime It takes smokers in qult smokan pennanenliy is 13 years? Complete parts [a] through {8]. 11.2 16.2 13.3 10.3 13.4 15.? 15.1 22.1 15.2 13.7 12.6 11.5 20.6 16.7 152 12.3 12.3 8.3 8.8 11.4 14.4 17.6 22.4 14.? 11.1 11.6 7.5 21.2 10.6 8.3 BB 21.2 [a] ldenlify Ine claim and slate the null hyanhesis and allematlve hymthesis. on. H0: \">13 0 e. Hn:pa13[dalm) O i:. Ho: p>13[clalm) Ha: ps13[claim) lep13 Ha:|_.=13 [b] ldenlify Ine standardized test statislic. Uw tednulogy. z = (Round 1mm deCimal places as needed.) (c) Find the P-value. Use ted'irnlqyy. P= (Rmnd in [tires decimal places as needed 1 [d] Decide whelher ho reject urfail m reject the null hypothesis and (e) innerplet the declslcin in the context of the original claim at [he 3% level of slgn ifnance. O A. Fail in reject Hn. Thele Is sucienl euldence in reiect the Helm thatthe rrieen tlnie it lakes smokers In duil O E. Reject Hg. Thele Is sulcienl evldence m reject lhe claIm that the mean tllne it lakes smokers no quit smoking smokan pen'rianenny is 13 years. pennanenlty is 13 years. 0 c. Reject no. There is ml sufcient evidencein reject the claim thal the mean lime itlakes smkeniin quit smoklng O n. Failtin reject Ho. There is not sulciem evidence in reject the claim that the mean time ll lakes smokers in dull pen'naneny is 13 years. smk'rig perrnanenliy is 13 years. Use a t-test to test the ctalm about die population meen p at the gluten level of signicance .3 ualnp the gluten semple statistics. Assume the population I: normally distributed. Chim: p. a! 26: u: = 0.10 Sample statistic-I: i= 21.6. s = 5.2, n = 12 Mat are the null and alternative hypotheses? Choose the correct answer below. DA. Hum-=26 Cue. Ho:p#26 Ham-=25 Halp=26 Dc. anp=25 on. Homsil Ha:pai26 Ha:p:!26 Mat Ie the value ofthe stenderdlzed teetetetistic? The standardized test statistic is D. [Round to two decimal places as needed.) What Is the P-velue ofthe test statistic? P-velue= |:| [Round to drree decimal places es needed.) Decide \"BUB? to reject or fall to reject the null hypothesis. D A. Feil to reject Hn- There Is enough evidence to support the claim. If] B. Reject Hg. There is not enough evidence to support lire claim. D C. Feil to reject Hn- There Is not enoth evldenoe to support the delm. D D. Reject \"0' There is enough evidence to support the clelm. The accorripa'iying data as the length (in centimeters] and giths [in centimeters] oi 12 ha'hor seals. Find the equation oi the regession line. Then consthct a scatter plot of the data and draw the regression line. Then use the regressior equation tn predict the vine ol yfor each ofthe given x-viues, if meaningful. If the x-viue is not meaningful to predict the value of y, explain Why not. (x-140cm (bu-172cm (chi-164cm (oh-153cm a Clicli the icon to view the tulle oflengths and g'rths The equation oi the regression line is iii 3 1- [Round to two decimal places as needed.) Construct a scatter plot or the data and draw the regression line. Plot length on the horizontal axis and girth on the vertical axis. Choose the correct graph below. OA- OB. m 9. of (a) Predict the girth for a length of14l] cm, if it is memingfil. Select the correct choice below aid, if necessary, ll in the answer no: with'n you choice 0 A. ,2. DC. on. . a a Ian '50 crri (Round to two decimal places as needed.) O B. It is not meaningful to predict this value of)! because it I 140 is inside the range ot the original data. 0 c. It is not meaninng to predict this value of)! because it - 1-14] is not an Hiatus in the original data. (b) Predict the girth for a length of1?2 cm, if it is memingfil. Select the correct choice below aid, if necessary, ll in the answer no: with'n you choice \f


