Question
%% lastNameFirstNameA7_Hw.m %{Reads operational and flow rate data from an Excel workbook and calculates the daily and average power for the produced by two Hydroelectric


%% lastNameFirstNameA7_Hw.m
%{Reads operational and flow rate data from an Excel workbook and calculates the daily and average power for the produced by two Hydroelectric power stations given the daily flow rate for each dam%}
clear
clc
%% Read the qFlow data from an xlsx (Excel) file 'A7Hw_pwr.xls'
% Verify the size and length of the array dataIn and ouput the quantities% to the screen using the disp function dataIn = readmatrix('A7Hw_pwr.xlsx');
%% Create a 1 x 2 row array hHead that contains the hydrostatic head in meters for
% each station and a 1 x 2 row array eta that contains the overall
% efficiencies Create a third array qFlow ( it will be an (n-2)x 2 array
)% that contains the average daly flow rate data in m^3/s for each
% hydro-station for 31 days. (Use comments to indicate the units of the
% quantities you are defining.) Check the lengths , sizes and dimensions
% of each of the new arrays.
%% Using the disp function write the values of the hydrostatic head and the
% efficiency for each station to the screen (to make it easy to see use
% disp('quantity name') follwed by disp(quantity value' forr each of the quantitities
%% Calculate the power produced by each station
% The Power in Watts [W] produced by each station is given by
% pwr = g*dens*eta.*qFlow.*hHead [W]
% dens is the density of water - 1000 kg/m^3
% g = acceleration due to gravity - 9.8 m/s^2
%% Convert pwr from Watts to MegaWatts
% Find the maximum, mininum and average power in MegaWatts produced by each
% station Output these separately to the screen using the fprintf function
%% Create a new array that has 4 columns.
% The first column should contain the flow rate for station 1, the second
% column should contain the daily power calculated for station
% 1. The third column should contain the flow rate for station 2 and the
% fourth column the daily power for station 2
%% Round the values in the new array to the nearest integer
%% The writematrix function will write the new array to an Excel workbook
writematrix(arrayName, 'A7Hw-2_out.xlsx')
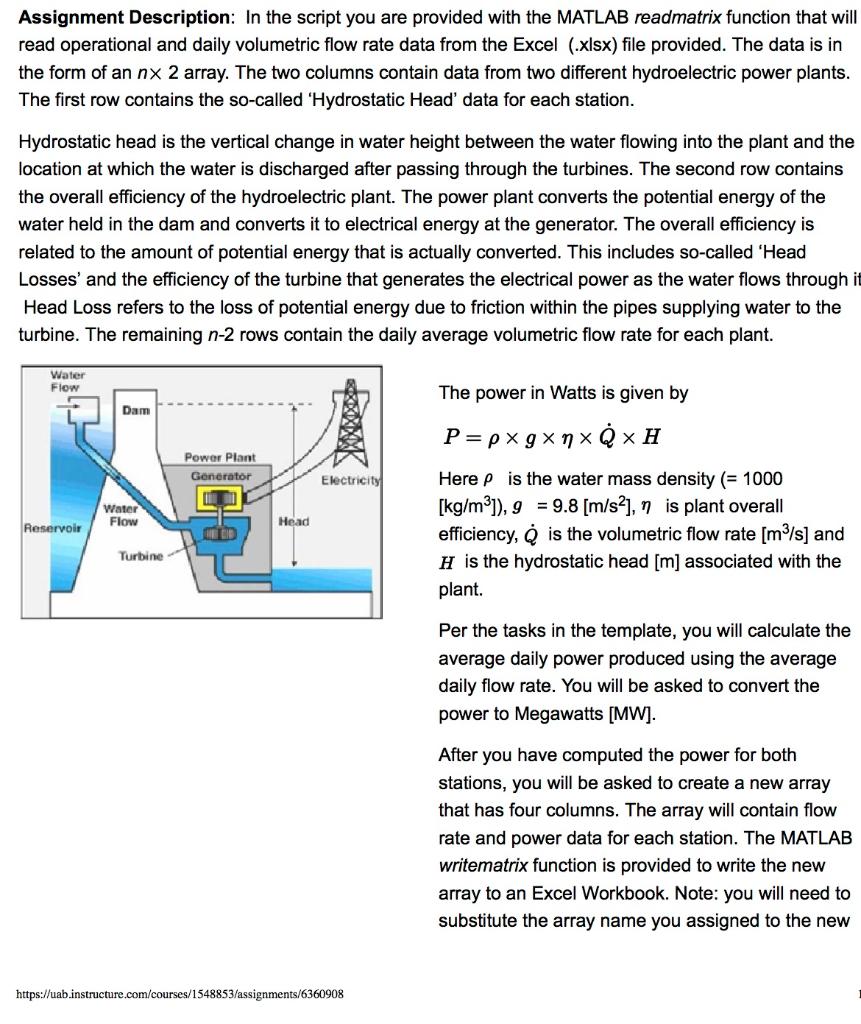
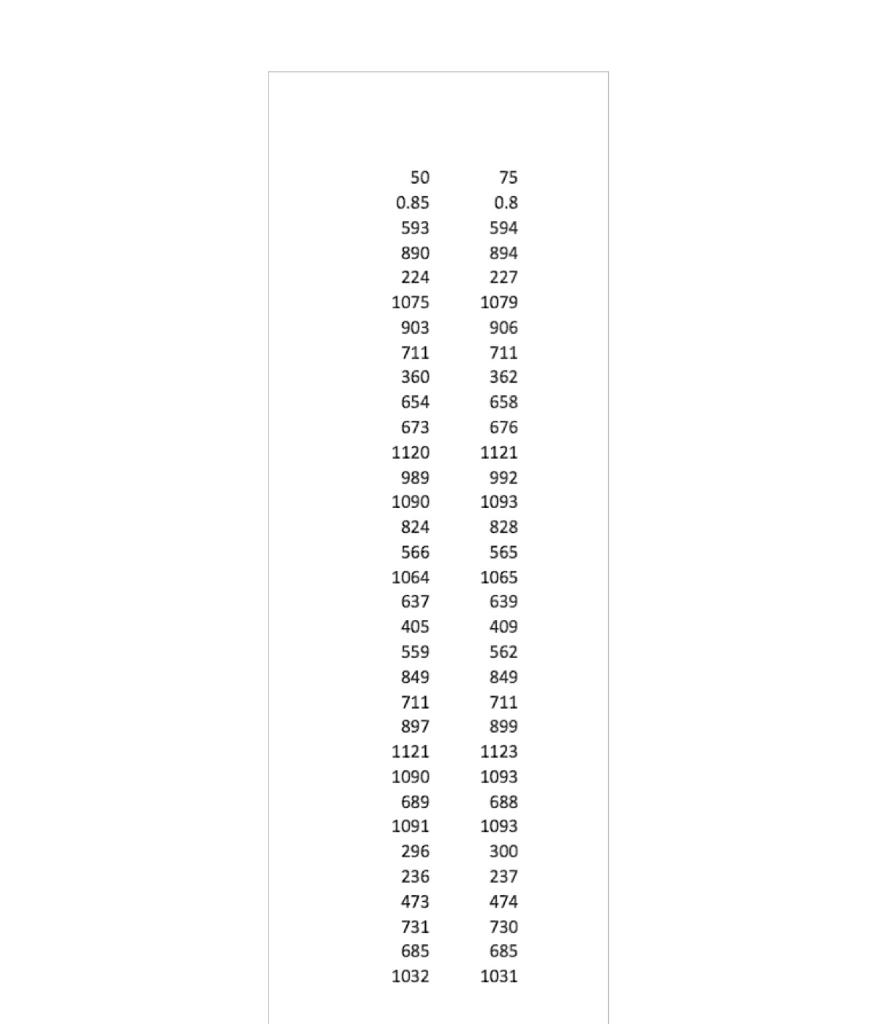
Assignment Description: In the script you are provided with the MATLAB readmatrix function that will read operational and daily volumetric flow rate data from the Excel (.xlsx) file provided. The data is in the form of an nx 2 array. The two columns contain data from two different hydroelectric power plants. The first row contains the so-called 'Hydrostatic Head' data for each station. Hydrostatic head is the vertical change in water height between the water flowing into the plant and the location at which the water is discharged after passing through the turbines. The second row contains the overall efficiency of the hydroelectric plant. The power plant converts the potential energy of the water held in the dam and converts it to electrical energy at the generator. The overall efficiency is related to the amount of potential energy that is actually converted. This includes so-called 'Head Losses' and the efficiency of the turbine that generates the electrical power as the water flows through it Head Loss refers to the loss of potential energy due to friction within the pipes supplying water to the turbine. The remaining n-2 rows contain the daily average volumetric flow rate for each plant. Water Flow The power in Watts is given by Dam P=pxgxnx Q x H Power Plant Generator Electricity Water Flow Head Reservoir Here P is the water mass density (= 1000 [kg/m3]), 9 = 9.8 [m/s], on is plant overall efficiency, is the volumetric flow rate [m3/s) and H is the hydrostatic head [m] associated with the plant. Turbine Per the tasks in the template, you will calculate the average daily power produced using the average daily flow rate. You will be asked to convert the power to Megawatts [MW]. After you have computed the power for both stations, you will be asked to create a new array that has four columns. The array will contain flow rate and power data for each station. The MATLAB writematrix function is provided to write the new array to an Excel Workbook. Note: you will need to substitute the array name you assigned to the new https://uab.instructure.com/courses/1548853/assignments/6360908 50 0.85 593 890 224 1075 903 711 75 0.8 594 894 227 1079 906 711 362 360 658 676 1121 992 1093 828 565 1065 639 654 673 1120 989 1090 824 566 1064 637 405 559 849 711 897 1121 1090 689 1091 296 236 473 731 685 1032 409 562 849 711 899 1123 1093 688 1093 300 237 474 730 685 1031 Assignment Description: In the script you are provided with the MATLAB readmatrix function that will read operational and daily volumetric flow rate data from the Excel (.xlsx) file provided. The data is in the form of an nx 2 array. The two columns contain data from two different hydroelectric power plants. The first row contains the so-called 'Hydrostatic Head' data for each station. Hydrostatic head is the vertical change in water height between the water flowing into the plant and the location at which the water is discharged after passing through the turbines. The second row contains the overall efficiency of the hydroelectric plant. The power plant converts the potential energy of the water held in the dam and converts it to electrical energy at the generator. The overall efficiency is related to the amount of potential energy that is actually converted. This includes so-called 'Head Losses' and the efficiency of the turbine that generates the electrical power as the water flows through it Head Loss refers to the loss of potential energy due to friction within the pipes supplying water to the turbine. The remaining n-2 rows contain the daily average volumetric flow rate for each plant. Water Flow The power in Watts is given by Dam P=pxgxnx Q x H Power Plant Generator Electricity Water Flow Head Reservoir Here P is the water mass density (= 1000 [kg/m3]), 9 = 9.8 [m/s], on is plant overall efficiency, is the volumetric flow rate [m3/s) and H is the hydrostatic head [m] associated with the plant. Turbine Per the tasks in the template, you will calculate the average daily power produced using the average daily flow rate. You will be asked to convert the power to Megawatts [MW]. After you have computed the power for both stations, you will be asked to create a new array that has four columns. The array will contain flow rate and power data for each station. The MATLAB writematrix function is provided to write the new array to an Excel Workbook. Note: you will need to substitute the array name you assigned to the new https://uab.instructure.com/courses/1548853/assignments/6360908 50 0.85 593 890 224 1075 903 711 75 0.8 594 894 227 1079 906 711 362 360 658 676 1121 992 1093 828 565 1065 639 654 673 1120 989 1090 824 566 1064 637 405 559 849 711 897 1121 1090 689 1091 296 236 473 731 685 1032 409 562 849 711 899 1123 1093 688 1093 300 237 474 730 685 1031Step by Step Solution
There are 3 Steps involved in it
Step: 1

Get Instant Access to Expert-Tailored Solutions
See step-by-step solutions with expert insights and AI powered tools for academic success
Step: 2

Step: 3

Ace Your Homework with AI
Get the answers you need in no time with our AI-driven, step-by-step assistance
Get Started


