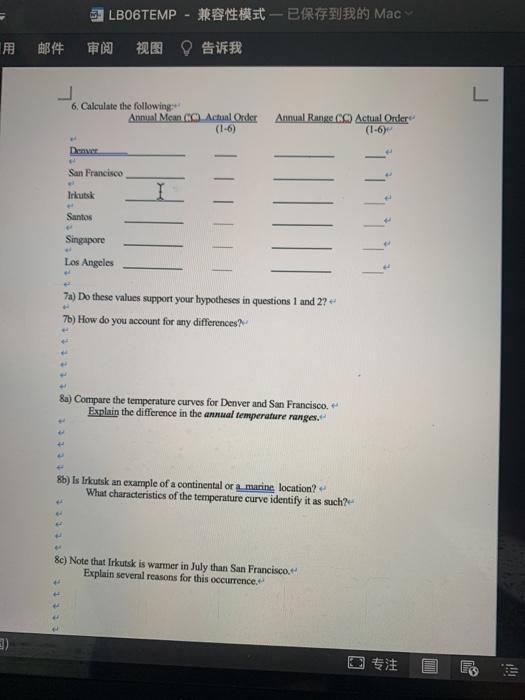
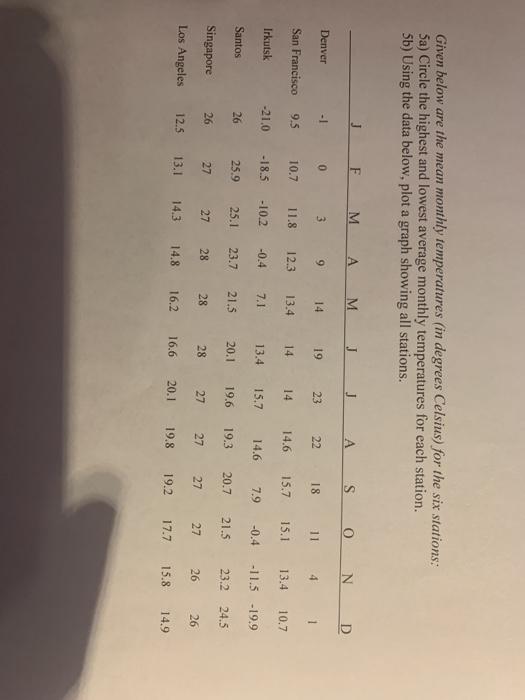
LBO6TEMP -Mac L 6. Calculate the following: Annual Mean C Achil Order Annual Range (0) Actual Order (1-6) Denver San Francisco Irkutsk Santos Singapore Los Angeles 7a) Do these values support your hypotheses in questions 1 and 2? 7b) How do you account for any differences 8a) Compare the temperature curves for Denver and San Francisco Explain the difference in the annual temperature ranges. 8b) Is Irkutsk an example of a continental or a marine location? What characteristics of the temperature curve identify it as such? 8c) Note that Irkutsk is warmer in July than San Francisco Explain several reasons for this occurrence. Given below are the mean monthly temperatures in degrees Celsius) for the six stations: 5a) Circle the highest and lowest average monthly temperatures for each station. 5b) Using the data below, plot a graph showing all stations. J F M A M J J A S 0 N D Denver -1 0 3 9 14 19 23 22 18 11 4 1 San Francisco 9.5 10.7 11.8 12.3 13.4 14 14.6 15.7 15.1 13.4 10.7 Irkutsk -21.0 -18.5 - 10.2 -0.4 7.1 13.4 15.7 14.6 7.9 -0.4 -11.5 -19.9 Santos 26 25.9 25.1 23.7 21.5 20.1 19,6 19.3 20.7 21.5 23.2 24.5 Singapore 26 27 27 28 28 28 27 27 27 27 26 26 Los Angeles 12.5 13.1 14.3 14.8 16.2 16.6 20.1 19.8 19.2 17.7 15.8 14.9 LBO6TEMP -Mac L 6. Calculate the following: Annual Mean C Achil Order Annual Range (0) Actual Order (1-6) Denver San Francisco Irkutsk Santos Singapore Los Angeles 7a) Do these values support your hypotheses in questions 1 and 2? 7b) How do you account for any differences 8a) Compare the temperature curves for Denver and San Francisco Explain the difference in the annual temperature ranges. 8b) Is Irkutsk an example of a continental or a marine location? What characteristics of the temperature curve identify it as such? 8c) Note that Irkutsk is warmer in July than San Francisco Explain several reasons for this occurrence. Given below are the mean monthly temperatures in degrees Celsius) for the six stations: 5a) Circle the highest and lowest average monthly temperatures for each station. 5b) Using the data below, plot a graph showing all stations. J F M A M J J A S 0 N D Denver -1 0 3 9 14 19 23 22 18 11 4 1 San Francisco 9.5 10.7 11.8 12.3 13.4 14 14.6 15.7 15.1 13.4 10.7 Irkutsk -21.0 -18.5 - 10.2 -0.4 7.1 13.4 15.7 14.6 7.9 -0.4 -11.5 -19.9 Santos 26 25.9 25.1 23.7 21.5 20.1 19,6 19.3 20.7 21.5 23.2 24.5 Singapore 26 27 27 28 28 28 27 27 27 27 26 26 Los Angeles 12.5 13.1 14.3 14.8 16.2 16.6 20.1 19.8 19.2 17.7 15.8 14.9


