Question
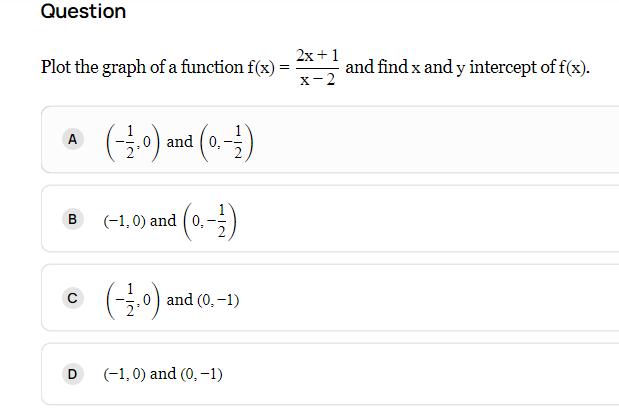
Question Plot the graph of a function f(x) A B C (1.0) and (0,-) (-1,0) and (0,-) (-1,0) and (0, -1) (-1,0) and (0,

Question Plot the graph of a function f(x) A B C (1.0) and (0,-) (-1,0) and (0,-) (-1,0) and (0, -1) (-1,0) and (0, -1) = 2x + 1 x-2 and find x and y intercept of f(x).
Step by Step Solution
3.44 Rating (157 Votes )
There are 3 Steps involved in it
Step: 1
GIVEN function is fx 2x 1 x 2 1 take some values of x to plot ...
Get Instant Access to Expert-Tailored Solutions
See step-by-step solutions with expert insights and AI powered tools for academic success
Step: 2

Step: 3

Ace Your Homework with AI
Get the answers you need in no time with our AI-driven, step-by-step assistance
Get StartedRecommended Textbook for
College Algebra Graphs and Models
Authors: Marvin L. Bittinger, Judith A. Beecher, David J. Ellenbogen, Judith A. Penna
5th edition
321845404, 978-0321791009, 321791002, 978-0321783950, 321783956, 978-0321845405
Students also viewed these Mathematics questions
Question
Answered: 1 week ago
Question
Answered: 1 week ago
Question
Answered: 1 week ago
Question
Answered: 1 week ago
Question
Answered: 1 week ago
Question
Answered: 1 week ago
Question
Answered: 1 week ago
Question
Answered: 1 week ago
Question
Answered: 1 week ago
Question
Answered: 1 week ago
Question
Answered: 1 week ago
Question
Answered: 1 week ago
Question
Answered: 1 week ago
Question
Answered: 1 week ago
Question
Answered: 1 week ago
Question
Answered: 1 week ago
Question
Answered: 1 week ago
Question
Answered: 1 week ago
View Answer in SolutionInn App


