Learn to use Apache Spark with Python
Q1c to Q3d
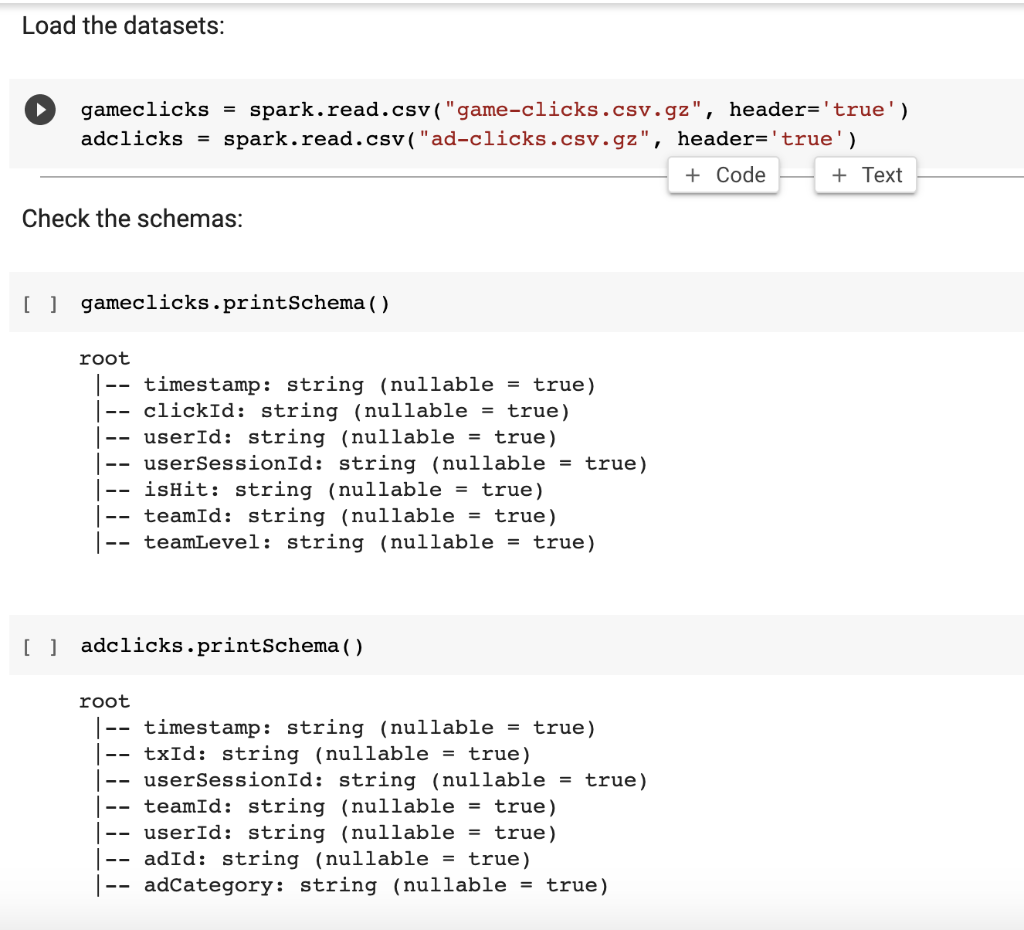
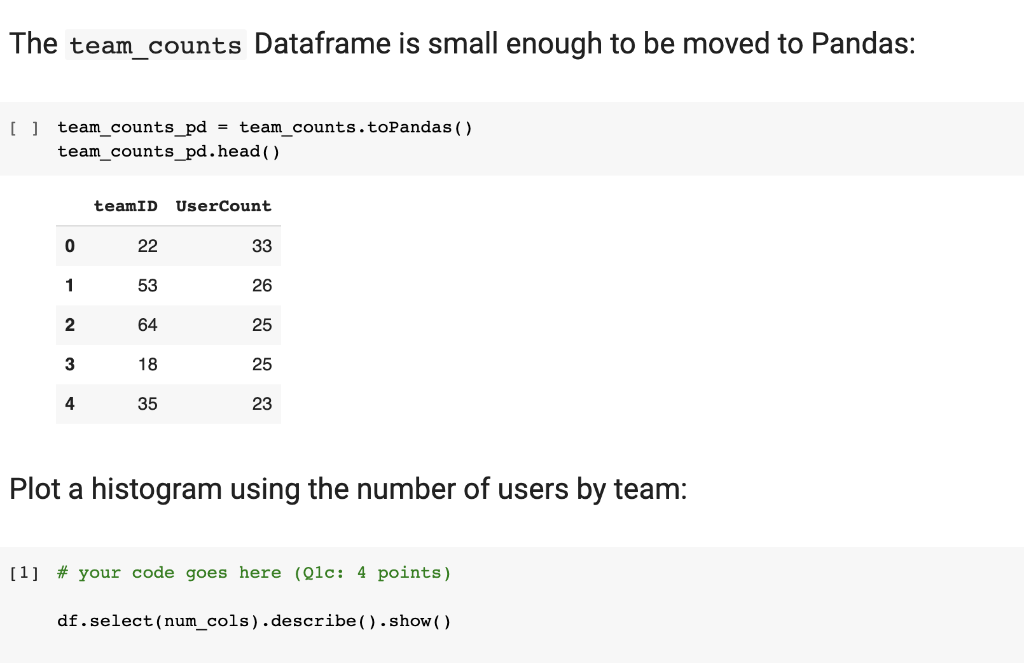
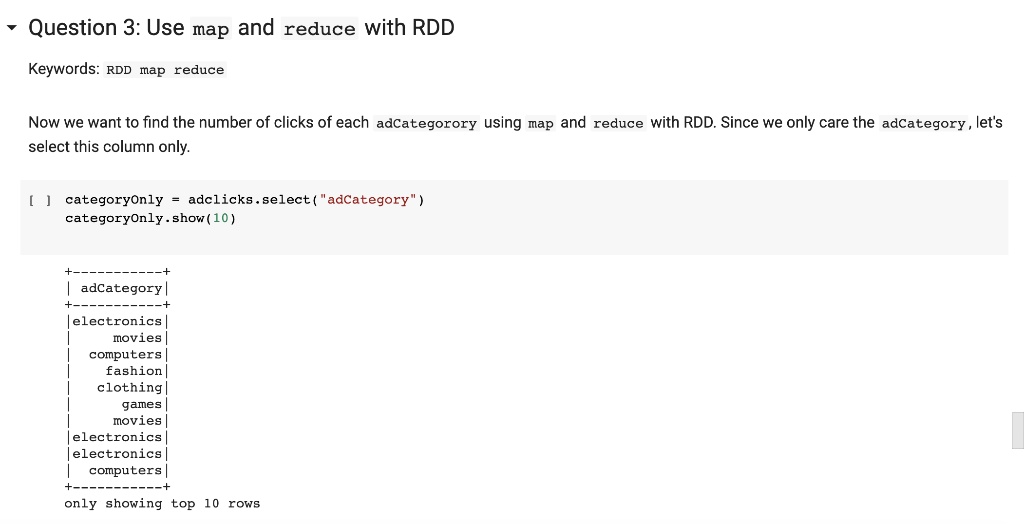

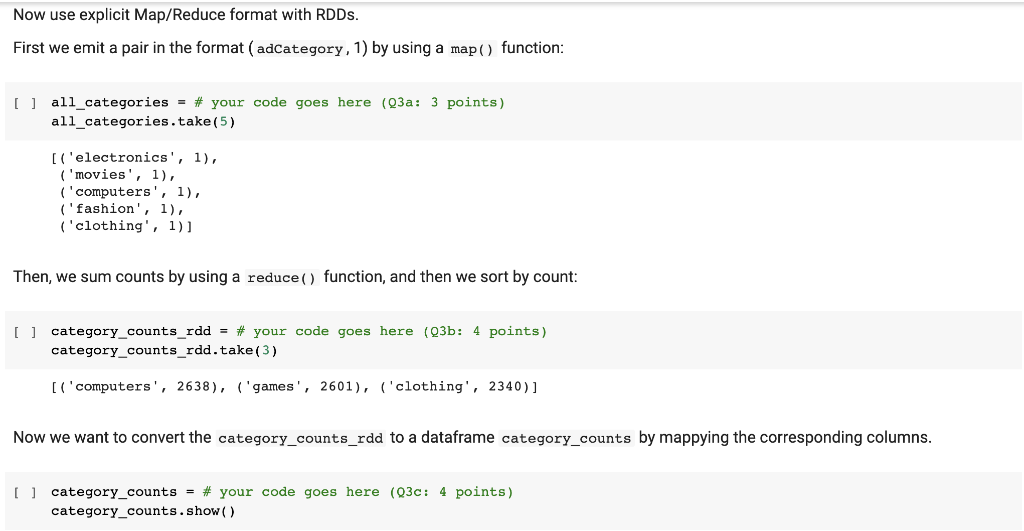
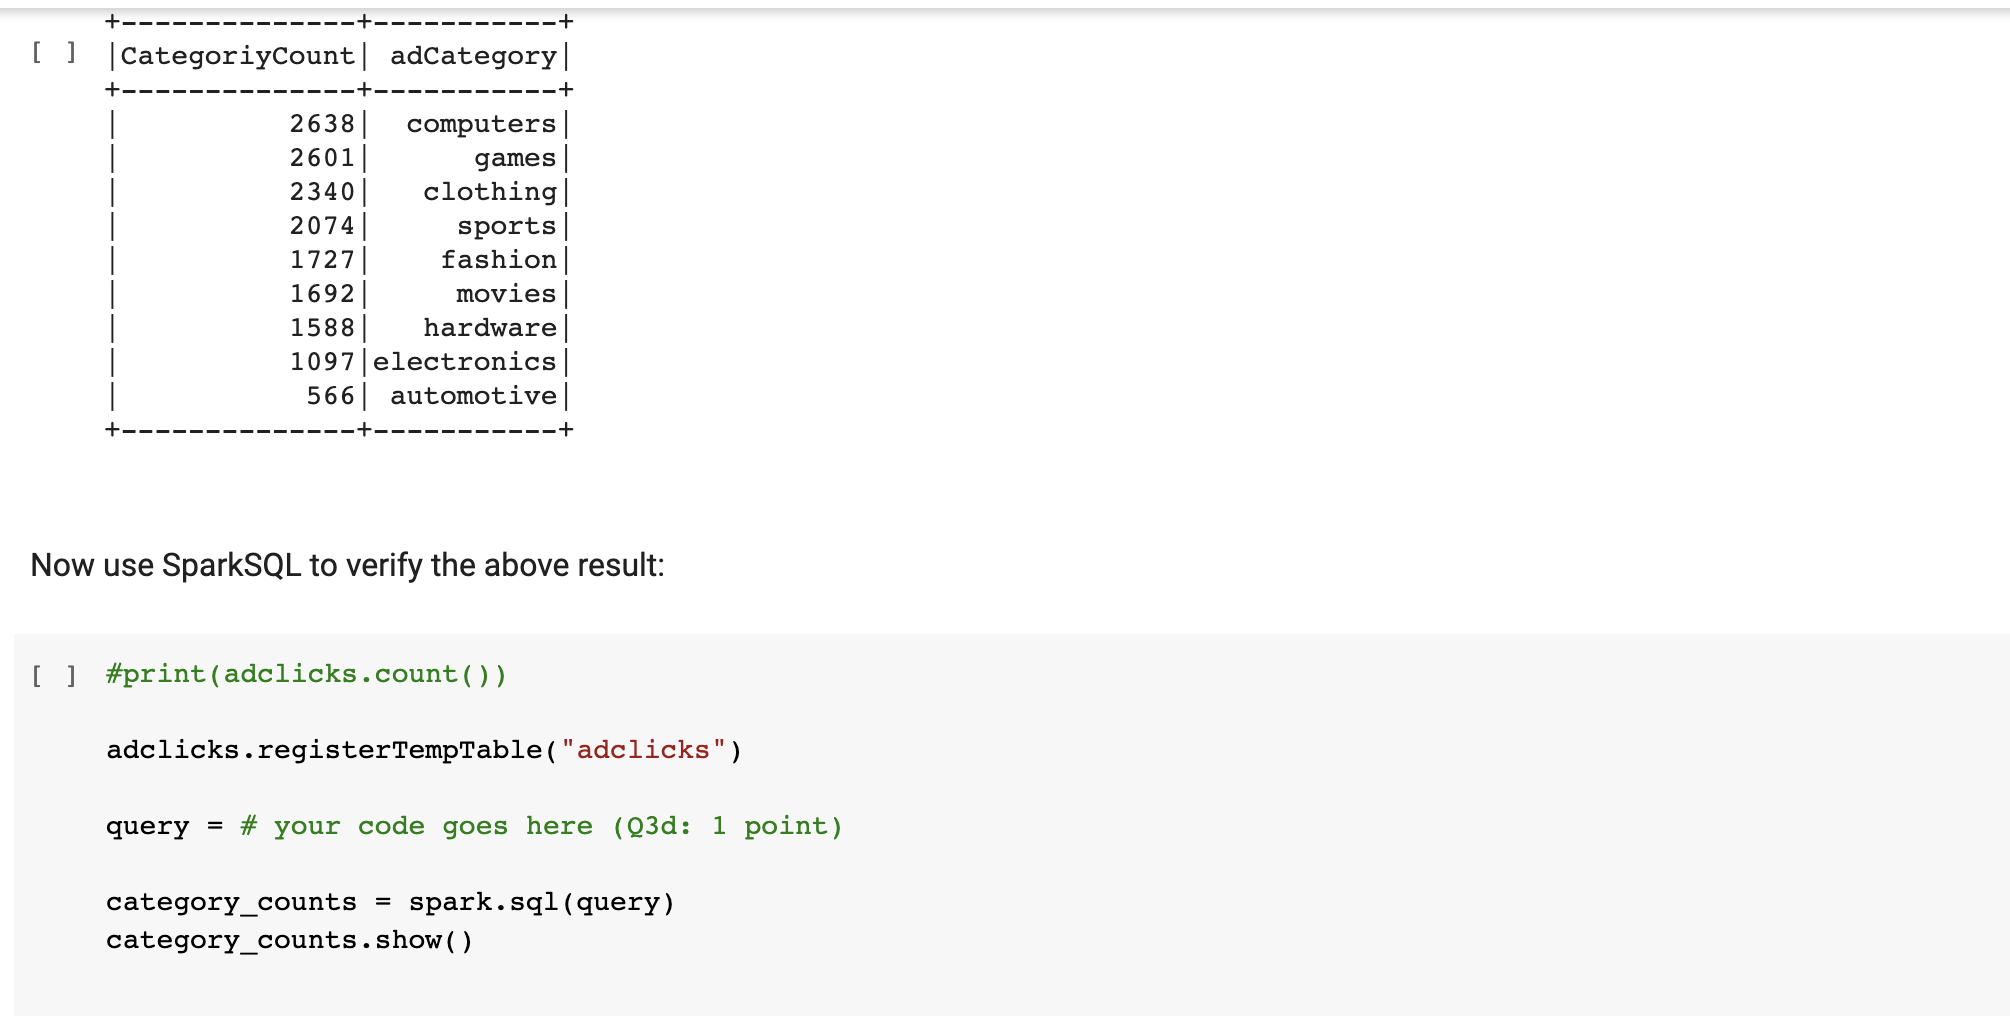
Load the datasets: = gameclicks spark.read.csv ("game-clicks.csv.gz", header='true') adclicks = spark.read.csv ("ad-clicks.csv.gz", header='true') + Code + Text Check the schemas: [] gameclicks.printSchema ( ) -- root timestamp: string (nullable = true) |-- clickId: string (nullable = true) -- userId: string (nullable = true) |-- users ionId: string (nullable = true) |-- ishit: string (nullable = true) |-- teamId: string (nullable = true) |-- teamLevel: string (nullable = true) [ ] adclicks.printSchema () root |-- timestamp: string (nullable = true) |-- txId: string (nullable = true) |-- userSessionId: string (nullable = true) -- teamId: string (nullable = true) | -- userId: string (nullable = true) -- adid: string (nullable = true) |-- adCategory: string (nullable = true) The team_counts Dataframe is small enough to be moved to Pandas: [ ] team_counts_pd = team_counts.toPandas ( ) team_counts_pd.head() teamID UserCount 0 22 33 1 53 26 2 64 25 3 18 25 4 35 23 Plot a histogram using the number of users by team: [1] # your code goes here (Q1c: 4 points) df.select(num_cols).describe().show() Question 3: Use map and reduce with RDD Keywords: RDD map reduce Now we want to find the number of clicks of each adCategorory using map and reduce with RDD. Since we only care the adCategory, let's select this column only. U categoryOnly - adclicks.select("adCategory") categoryOnly.show(10) | adCategory electronics movies computers fashion clothing games movies electronics electronics | computers only showing top 10 rows Now use explicit Map/Reduce format with RDDs. First we emit a pair in the format (adCategory, 1) by using a m Now use explicit Map/Reduce format with RDDs. First we emit a pair in the format (adCategory, 1) by using a map() function: [ ] all_categories = # your code goes here (03a: 3 points) all_categories.take (5) [('electronics', 1), ('movies', 1), ('computers', 1), ('fashion', 1), ('clothing', 1)] Then, we sum counts by using a reduce () function, and then we sort by count: [ ] category_counts_rdd = # your code goes here (03b: 4 points) category_counts_rdd.take(3) [('computers', 2638), ('games', 2601), ('clothing', 2340)] Now we want to convert the category_counts_rdd to a dataframe category_counts by mappying the corresponding columns. [ ] category_counts = # your code goes here (03c: 4 points) category_counts.show() +-- + [ ] CategoriyCount| adCategory|| +- 2638 computers 2601 games 2340 clothing 2074 sports 1727 fashion 1692 movies| 1588 hardware 1097 | electronics 566| automotive -+ | +- Now use SparkSQL to verify the above result: [ ] #print(adclicks.count()) adclicks.registerTemptable("adclicks") query = # your code goes here (Q3d: 1 point) category_counts = spark.sql (query) category_counts.show() Load the datasets: = gameclicks spark.read.csv ("game-clicks.csv.gz", header='true') adclicks = spark.read.csv ("ad-clicks.csv.gz", header='true') + Code + Text Check the schemas: [] gameclicks.printSchema ( ) -- root timestamp: string (nullable = true) |-- clickId: string (nullable = true) -- userId: string (nullable = true) |-- users ionId: string (nullable = true) |-- ishit: string (nullable = true) |-- teamId: string (nullable = true) |-- teamLevel: string (nullable = true) [ ] adclicks.printSchema () root |-- timestamp: string (nullable = true) |-- txId: string (nullable = true) |-- userSessionId: string (nullable = true) -- teamId: string (nullable = true) | -- userId: string (nullable = true) -- adid: string (nullable = true) |-- adCategory: string (nullable = true) The team_counts Dataframe is small enough to be moved to Pandas: [ ] team_counts_pd = team_counts.toPandas ( ) team_counts_pd.head() teamID UserCount 0 22 33 1 53 26 2 64 25 3 18 25 4 35 23 Plot a histogram using the number of users by team: [1] # your code goes here (Q1c: 4 points) df.select(num_cols).describe().show() Question 3: Use map and reduce with RDD Keywords: RDD map reduce Now we want to find the number of clicks of each adCategorory using map and reduce with RDD. Since we only care the adCategory, let's select this column only. U categoryOnly - adclicks.select("adCategory") categoryOnly.show(10) | adCategory electronics movies computers fashion clothing games movies electronics electronics | computers only showing top 10 rows Now use explicit Map/Reduce format with RDDs. First we emit a pair in the format (adCategory, 1) by using a m Now use explicit Map/Reduce format with RDDs. First we emit a pair in the format (adCategory, 1) by using a map() function: [ ] all_categories = # your code goes here (03a: 3 points) all_categories.take (5) [('electronics', 1), ('movies', 1), ('computers', 1), ('fashion', 1), ('clothing', 1)] Then, we sum counts by using a reduce () function, and then we sort by count: [ ] category_counts_rdd = # your code goes here (03b: 4 points) category_counts_rdd.take(3) [('computers', 2638), ('games', 2601), ('clothing', 2340)] Now we want to convert the category_counts_rdd to a dataframe category_counts by mappying the corresponding columns. [ ] category_counts = # your code goes here (03c: 4 points) category_counts.show() +-- + [ ] CategoriyCount| adCategory|| +- 2638 computers 2601 games 2340 clothing 2074 sports 1727 fashion 1692 movies| 1588 hardware 1097 | electronics 566| automotive -+ | +- Now use SparkSQL to verify the above result: [ ] #print(adclicks.count()) adclicks.registerTemptable("adclicks") query = # your code goes here (Q3d: 1 point) category_counts = spark.sql (query) category_counts.show()