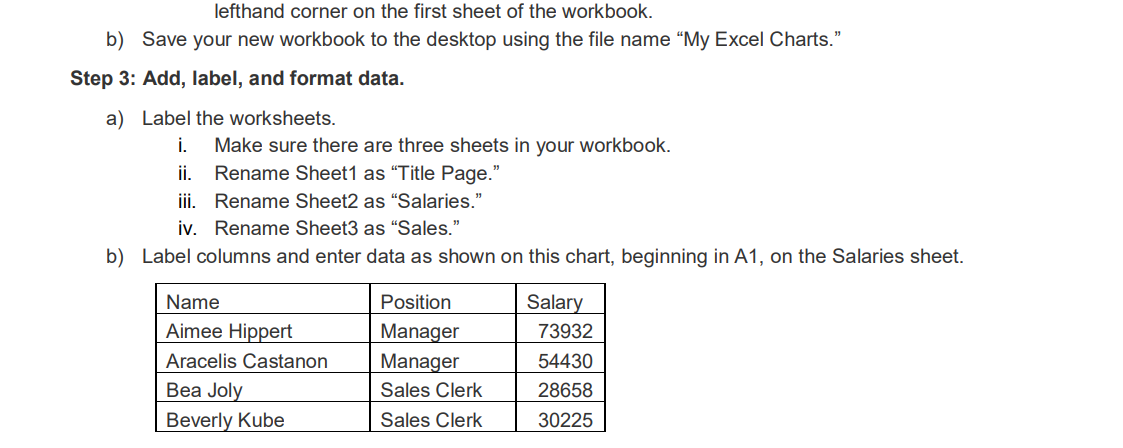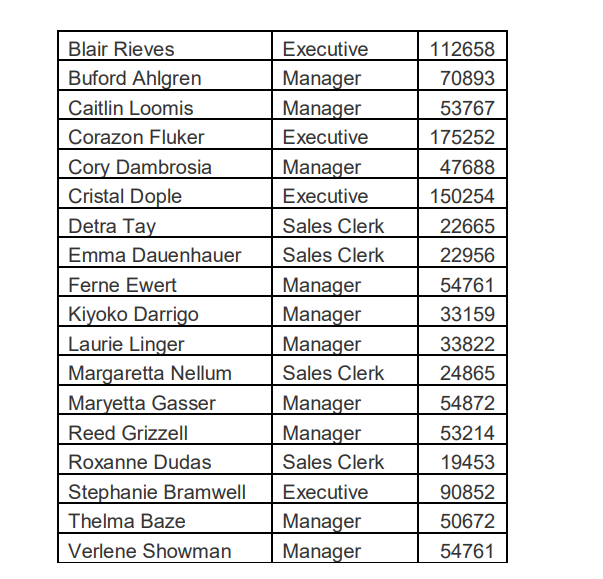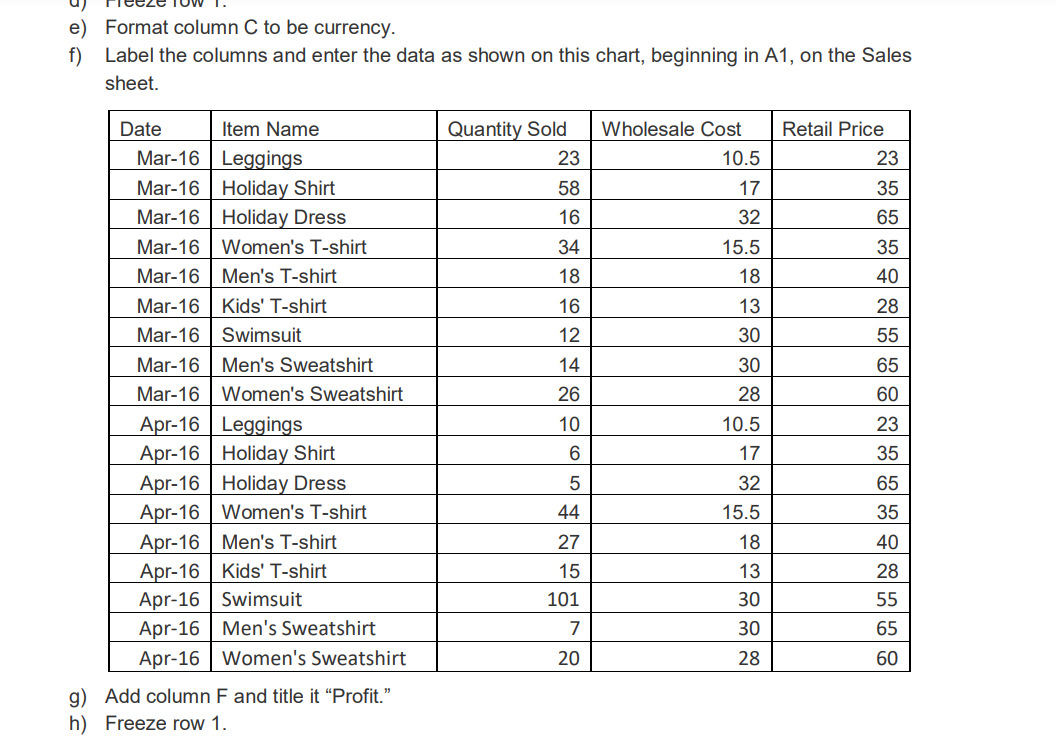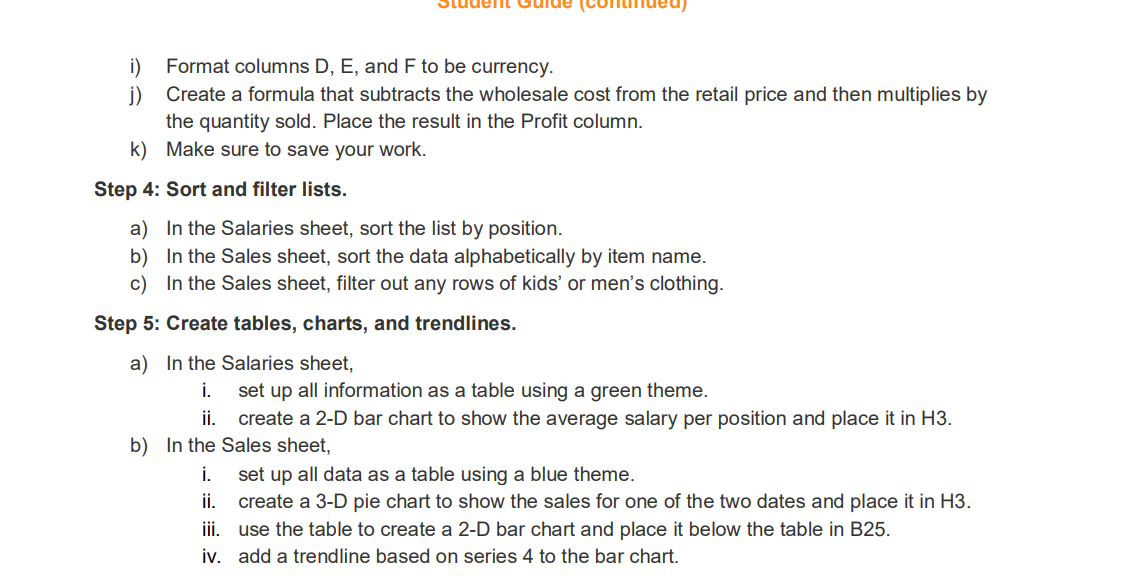


lefthand corner on the first sheet of the workbook. b) Save your new workbook to the desktop using the file name My Excel Charts." Step 3: Add, label, and format data. a) Label the worksheets. i. Make sure there are three sheets in your workbook. ii. Rename Sheet1 as Title Page." iii. Rename Sheet2 as "Salaries." iv. Rename Sheet3 as "Sales." b) Label columns and enter data as shown on this chart, beginning in A1, on the Salaries sheet. Name Aimee Hippert Aracelis Castanon Bea Joly Beverly Kube Position Manager Manager Sales Clerk Sales Clerk Salary 73932 54430 28658 30225 Blair Rieves Buford Ahlgren Caitlin Loomis Corazon Fluker Cory Dambrosia Cristal Dople Detra Tay Emma Dauenhauer Ferne Ewert Kiyoko Darrigo Laurie Linger Margaretta Nellum Maryetta Gasser Reed Grizzell Roxanne Dudas Stephanie Bramwell Thelma Baze Verlene Showman Executive Manager Manager Executive Manager Executive Sales Clerk Sales Clerk Manager Manager Manager Sales Clerk Manager Manager Sales Clerk Executive Manager Manager 112658 70893 53767 175252 47688 150254 22665 22956 54761 33159 33822 24865 54872 53214 19453 90852 50672 54761 e) Format column C to be currency. f) Label the columns and enter the data as shown on this chart, beginning in A1, on the Sales sheet. Quantity Sold 23 Wholesale Cost 10.5 Retail Price 23 58 35 16 17 32 15.5 18 34 65 35 40 18 16 13 28 55 12 30 14 30 65 Date Item Name Mar-16 Leggings Mar-16 Holiday Shirt Mar-16 Holiday Dress Mar-16 Women's T-shirt Mar-16 Men's T-shirt Mar-16 Kids' T-shirt Mar-16 Swimsuit Mar-16 Men's Sweatshirt Mar-16 Women's Sweatshirt Apr-16 Leggings Apr-16 Holiday Shirt Apr-16 Holiday Dress Apr-16 Women's T-shirt Apr-16 Men's T-shirt Apr-16 Kids' T-shirt Apr-16 Swimsuit Apr-16 Men's Sweatshirt Apr-16 Women's Sweatshirt 26 28 60 10 10.5 23 35 6 17 5 32 15.5 65 35 44 27 18 40 13 15 101 28 55 30 7 30 65 20 28 60 g) Add column F and title it Profit. h) Freeze row 1. i) Format columns D, E, and F to be currency. j) Create a formula that subtracts the wholesale cost from the retail price and then multiplies by the quantity sold. Place the result in the Profit column. k) Make sure to save your work. Step 4: Sort and filter lists. a) In the Salaries sheet, sort the list by position. b) In the Sales sheet, sort the data alphabetically by item name. c) In the Sales sheet, filter out any rows of kids' or men's clothing. Step 5: Create tables, charts, and trendlines. a) In the Salaries sheet, i. set up all information as a table using a green theme. ii. create a 2-D bar chart to show the average salary per position and place it in H3. b) In the Sales sheet, i. set up all data as a table using a blue theme. ii. create a 3-D pie chart to show the sales for one of the two dates and place it in H3. iii. use the table to create a 2-D bar chart and place it below the table in B25. iv. add a trendline based on series 4 to the bar chart. lefthand corner on the first sheet of the workbook. b) Save your new workbook to the desktop using the file name My Excel Charts." Step 3: Add, label, and format data. a) Label the worksheets. i. Make sure there are three sheets in your workbook. ii. Rename Sheet1 as Title Page." iii. Rename Sheet2 as "Salaries." iv. Rename Sheet3 as "Sales." b) Label columns and enter data as shown on this chart, beginning in A1, on the Salaries sheet. Name Aimee Hippert Aracelis Castanon Bea Joly Beverly Kube Position Manager Manager Sales Clerk Sales Clerk Salary 73932 54430 28658 30225 Blair Rieves Buford Ahlgren Caitlin Loomis Corazon Fluker Cory Dambrosia Cristal Dople Detra Tay Emma Dauenhauer Ferne Ewert Kiyoko Darrigo Laurie Linger Margaretta Nellum Maryetta Gasser Reed Grizzell Roxanne Dudas Stephanie Bramwell Thelma Baze Verlene Showman Executive Manager Manager Executive Manager Executive Sales Clerk Sales Clerk Manager Manager Manager Sales Clerk Manager Manager Sales Clerk Executive Manager Manager 112658 70893 53767 175252 47688 150254 22665 22956 54761 33159 33822 24865 54872 53214 19453 90852 50672 54761 e) Format column C to be currency. f) Label the columns and enter the data as shown on this chart, beginning in A1, on the Sales sheet. Quantity Sold 23 Wholesale Cost 10.5 Retail Price 23 58 35 16 17 32 15.5 18 34 65 35 40 18 16 13 28 55 12 30 14 30 65 Date Item Name Mar-16 Leggings Mar-16 Holiday Shirt Mar-16 Holiday Dress Mar-16 Women's T-shirt Mar-16 Men's T-shirt Mar-16 Kids' T-shirt Mar-16 Swimsuit Mar-16 Men's Sweatshirt Mar-16 Women's Sweatshirt Apr-16 Leggings Apr-16 Holiday Shirt Apr-16 Holiday Dress Apr-16 Women's T-shirt Apr-16 Men's T-shirt Apr-16 Kids' T-shirt Apr-16 Swimsuit Apr-16 Men's Sweatshirt Apr-16 Women's Sweatshirt 26 28 60 10 10.5 23 35 6 17 5 32 15.5 65 35 44 27 18 40 13 15 101 28 55 30 7 30 65 20 28 60 g) Add column F and title it Profit. h) Freeze row 1. i) Format columns D, E, and F to be currency. j) Create a formula that subtracts the wholesale cost from the retail price and then multiplies by the quantity sold. Place the result in the Profit column. k) Make sure to save your work. Step 4: Sort and filter lists. a) In the Salaries sheet, sort the list by position. b) In the Sales sheet, sort the data alphabetically by item name. c) In the Sales sheet, filter out any rows of kids' or men's clothing. Step 5: Create tables, charts, and trendlines. a) In the Salaries sheet, i. set up all information as a table using a green theme. ii. create a 2-D bar chart to show the average salary per position and place it in H3. b) In the Sales sheet, i. set up all data as a table using a blue theme. ii. create a 3-D pie chart to show the sales for one of the two dates and place it in H3. iii. use the table to create a 2-D bar chart and place it below the table in B25. iv. add a trendline based on series 4 to the bar chart


