Answered step by step
Verified Expert Solution
Question
1 Approved Answer
Less: Cost of goods sold Gross margin Less: SG&A expenses Operating profit margin EXHIBIT 1 Financial Data for Tiffany and TJX (in thousands) Net

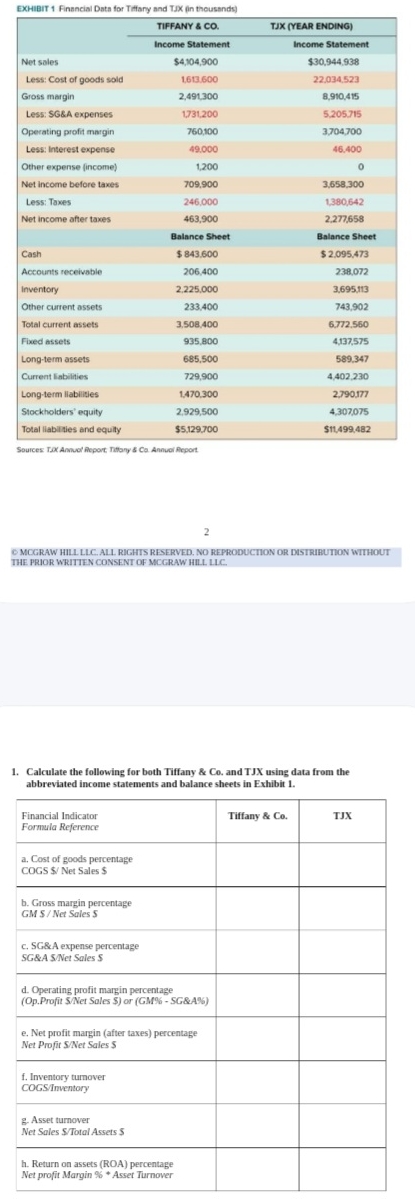
Less: Cost of goods sold Gross margin Less: SG&A expenses Operating profit margin EXHIBIT 1 Financial Data for Tiffany and TJX (in thousands) Net sales TIFFANY & CO. Income Statement TJX (YEAR ENDING) Income Statement $30,944,938 22.034,523 8,910,415 5,205,715 3,704,700 $4,104,900 1,613.600 2,491,300 1,731,200 760,100 Less: Interest expense 49.000 46.400 Other expense (income) 1,200 Net income before taxes 709,900 3,658,300 Less: Taxes 246,000 1,380,642 Net income after taxes 463,900 2,277,658 Balance Sheet Balance Sheet Cash $843,600 Accounts receivable 206,400 $2,095,473 238,072 Inventory 2,225,000 3,695,113 Other current assets 233,400 743,902 Total current assets 3,508,400 6,772.560 Fixed assets 935,800 4,137,575 Long-term assets 685,500 589,347 Current liabilities 729,900 4,402,230 Long-term liabilities 1,470,300 2,790,177 Stockholders' equity 2.929,500 4,307,075 Total liabilities and equity $5,129,700 $11,499,482 Sources: TJX Annual Report Tiffany & Co. Annual Report 2 MCGRAW HILL LLC. ALL RIGHTS RESERVED. NO REPRODUCTION OR DISTRIBUTION WITHOUT THE PRIOR WRITTEN CONSENT OF MCGRAW HILL LLC. 1. Calculate the following for both Tiffany & Co. and TJX using data from the abbreviated income statements and balance sheets in Exhibit 1. Financial Indicator Formula Reference Tiffany & Co. TJX a. Cost of goods percentage COGS $/ Net Sales $ b. Gross margin percentage GM S/Net Sales S c. SG&A expense percentage SG&A S/Net Sales S d. Operating profit margin percentage (Op.Profit S/Net Sales $) or (GM%-SG&A%) e. Net profit margin (after taxes) percentage Net Profit S/Net Sales S f. Inventory turnover COGS/Inventory g. Asset turnover Net Sales S/Total Assets $ h. Return on assets (ROA) percentage Net profit Margin %*Asset Turnover
Step by Step Solution
There are 3 Steps involved in it
Step: 1

Get Instant Access to Expert-Tailored Solutions
See step-by-step solutions with expert insights and AI powered tools for academic success
Step: 2

Step: 3

Ace Your Homework with AI
Get the answers you need in no time with our AI-driven, step-by-step assistance
Get Started


