

Question
Let g x fre f t dt where f is the function whose graph is shown y 6 g 6 9 g 9 0 3

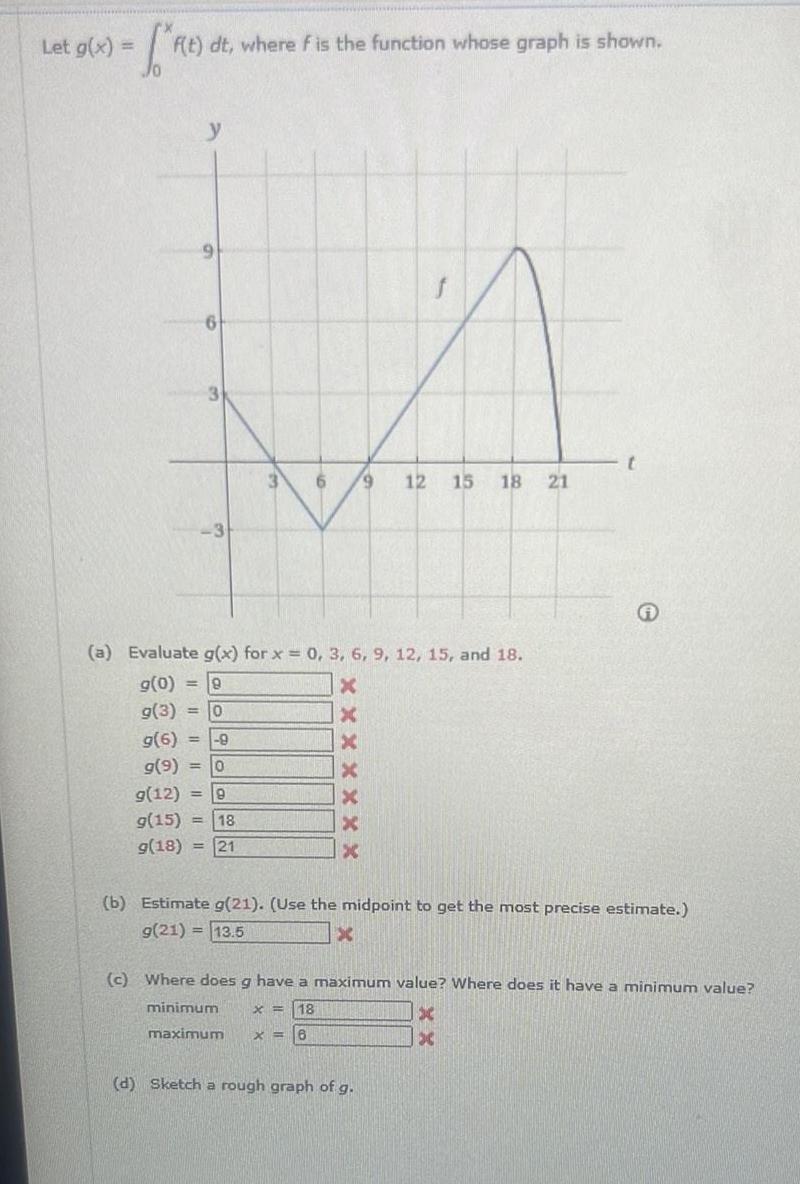
Let g x fre f t dt where f is the function whose graph is shown y 6 g 6 9 g 9 0 3 6 a Evaluate g x for x 0 3 6 9 12 15 and 18 9 g 0 g 3 0 g 12 9 g 15 18 g 18 21 X X x X X X X 12 15 18 21 e b Estimate g 21 Use the midpoint to get the most precise estimate g 21 13 5 X d Sketch a rough graph of g c Where does g have a maximum value Where does it have a minimum value minimum x x 18 maximum X 6 x
Step by Step Solution
There are 3 Steps involved in it
Step: 1

Get Instant Access to Expert-Tailored Solutions
See step-by-step solutions with expert insights and AI powered tools for academic success
Step: 2

Step: 3
Ace Your Homework with AI
Get the answers you need in no time with our AI-driven, step-by-step assistance
Get Started
Game Theory And Climate Change
Authors: Parkash Chander
1st Edition
0231545592, 9780231545594