

Answered step by step
Verified Expert Solution
Question
1 Approved Answer
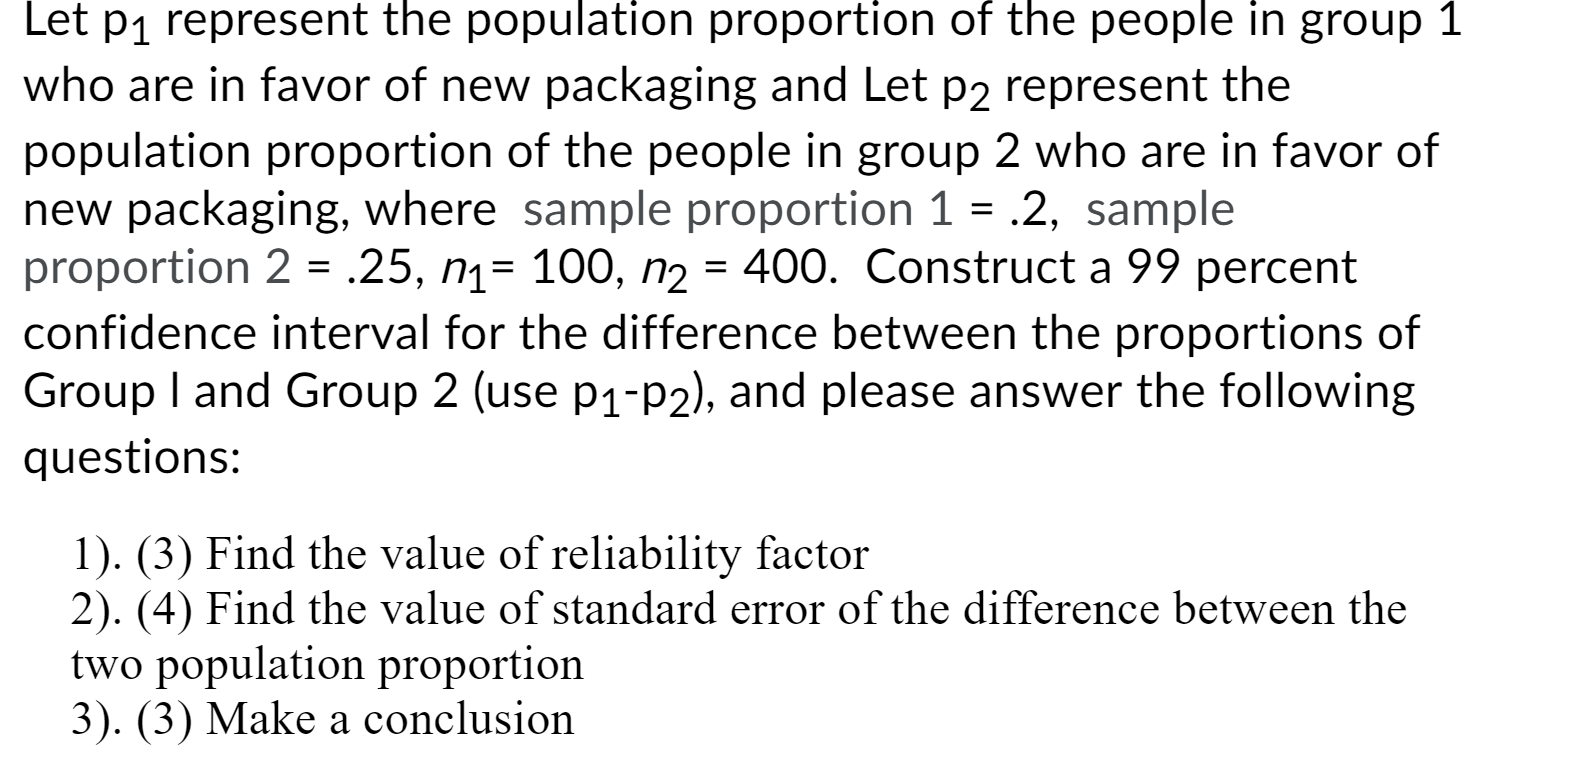
Let p1 represent the population proportion of the people in group 1 who are in favor of new packaging and Let p2 represent the population
Step by Step Solution
There are 3 Steps involved in it
Step: 1

Get Instant Access to Expert-Tailored Solutions
See step-by-step solutions with expert insights and AI powered tools for academic success
Step: 2

Step: 3
Ace Your Homework with AI
Get the answers you need in no time with our AI-driven, step-by-step assistance
Get Started
Variational Methods In Nonlinear Field Equations Solitary Waves Hylomorphic Solitons And Vortices
Authors: Vieri Benci, Donato Fortunato
1st Edition
3319069136, 9783319069135