Question
Let the diagram below represent the market for equities (stocks). Price is a representative price per share. Explain how the tendency of baby boomers to
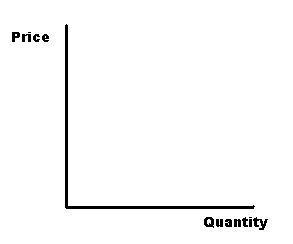
Let the diagram below represent the market for equities (stocks). Price is a representative price per share. Explain how the tendency of baby boomers to invest their savings by investing in equities (in preparation for retirement) might affect the equity market price and quantity. The supply of new offerings (Initial Public Offerings) also has increased over the same time period. The final results should show an increase in the equilibrium quantity exchanged accompanied by an increase in the equilibrium price. Restate observations in words (b).
a) GRAPHICAL ANALYSIS

Price Quantity
Step by Step Solution
There are 3 Steps involved in it
Step: 1

Get Instant Access to Expert-Tailored Solutions
See step-by-step solutions with expert insights and AI powered tools for academic success
Step: 2

Step: 3

Ace Your Homework with AI
Get the answers you need in no time with our AI-driven, step-by-step assistance
Get Started


