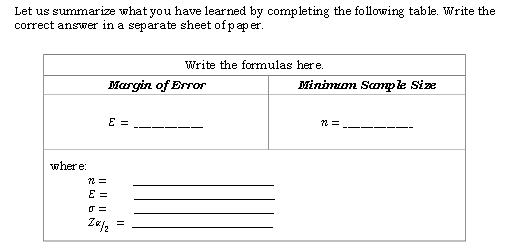
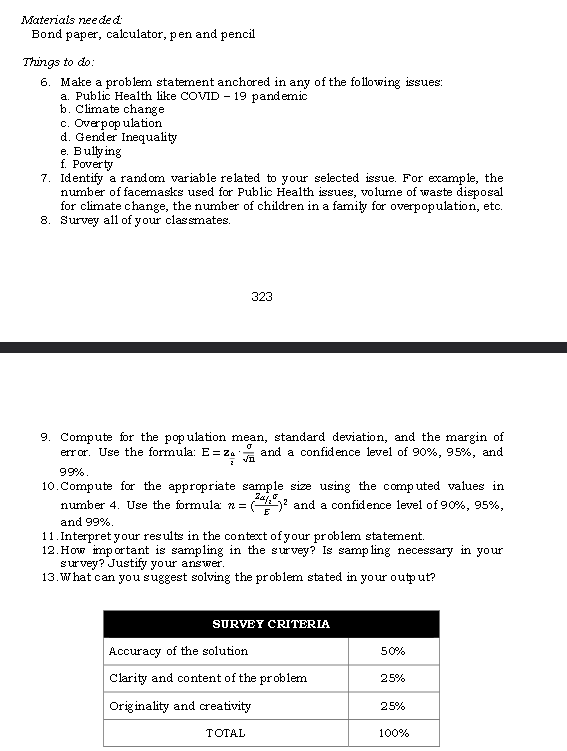
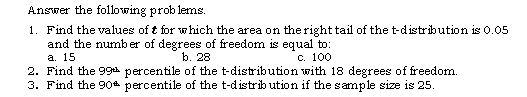
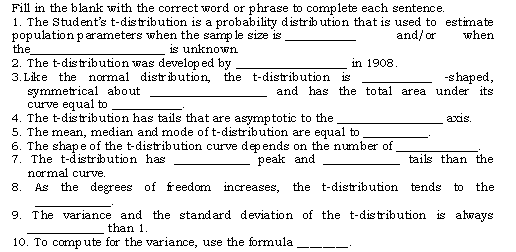
Let us summarize what you have learned by completing the following table. Write the Correct answer in a separate sheet of paper. Write the formulas here. Margin of Error Minimon Sor le Size there: E : T EMaterials needed Bond paper, calculator, pen and pencil Things to do: 6. Make a problem statement anchored in any of the following issues: a. Public Health like COVID - 19 pandemic b. Climate change c. Overpopulation d. Gender Inequality e. Bullying f. Poverty 7. Identify a random variable related to your selected issue. For example, the number of facemasks used for Public Health issues, volume of waste disposal for climate change, the number of children in a family for overpopulation, etc. 8. Survey all of your classmates. 323 9. Compute for the population mean, standard deviation, and the margin of error. Use the formula: E = zo , and a confidence level of 90%, 95%, and 99% 10. Compute for the appropriate sample size using the computed values in number 4. Use the formula a= ( ) and a confidence level of 90%, 95%, and 99%. 1 1. Interpret your results in the context of your problem statement. 12. How important is sampling in the survey? Is sampling necessary in your survey? Justify your answer. 13. What can you suggest solving the problem stated in your output? SURVEY CRITERIA Accuracy of the solution 50% Clarity and content of the problem 25% Originality and creativity 25% TOTAL 100%Answer the following problems. 1. Find the values of { for which the area on the right tail of the t-distribution is 0.05 and the number of degrees of freedom is equal to: a. 15 b. 28 C. 100 2. Find the 99h percentile of the t-distribution with 18 degrees of freedom. 3. Find the 904 percentile of the t-distribution if the sample size is 25.Fill in the blank with the correct word or phrase to complete each sentence. 1. The Student's t-distribution is a probability distribution that is used to estimate population parameters when the sample size is and/ or when the is unknown 2. The t-distribution was developed by in 1908. 3. Like the normal distribution, the t-distribution is -shaped, symmetrical about and has the total area under its curve equal to 4. The t-distribution has tails that are asymptotic to the 5. The mean, median and mode of t-distribution are equal to 6. The shape of the t-distribution curve depends on the number of 7. The t-distribution has peak and tails than the normal curve. 8. As the degrees of freedom increases, the t-distribution tends to the 9. The variance and the standard deviation of the t-distribution is always than 1. 10. To compute for the variance, use the formula