Answered step by step
Verified Expert Solution
Link Copied!

Question

1 Approved Answer

Let xt represent the annual glacial varve series (varve in astsa package). (30 points, 10 points each) (You can refer to file week3_glacier_estimation.R for part
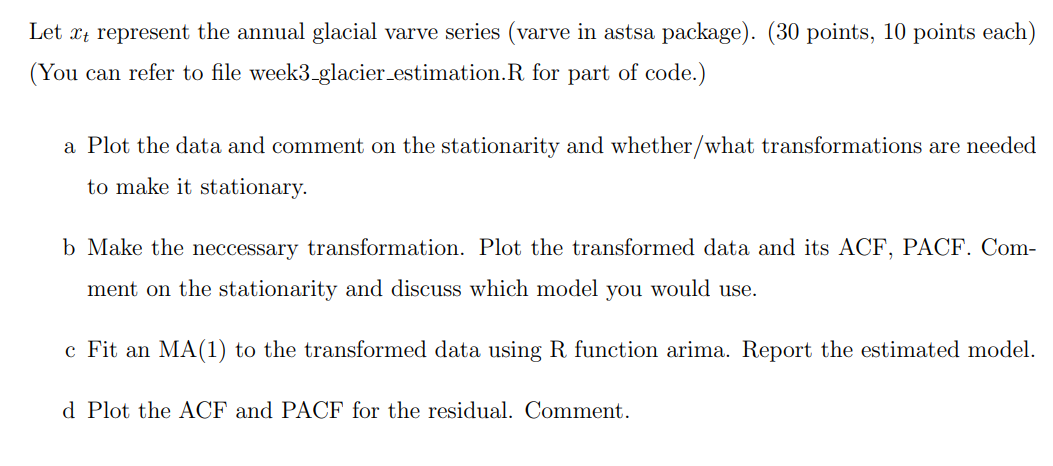
image text in transcribed

Let xt represent the annual glacial varve series (varve in astsa package). (30 points, 10 points each) (You can refer to file week3_glacier_estimation.R for part of code.) a Plot the data and comment on the stationarity and whether/what transformations are needed to make it stationary. b Make the neccessary transformation. Plot the transformed data and its ACF, PACF. Comment on the stationarity and discuss which model you would use. c Fit an MA(1) to the transformed data using R function arima. Report the estimated model. d Plot the ACF and PACF for the residual. Comment

Step by Step Solution

There are 3 Steps involved in it

Step: 1

blur-text-image

Get Instant Access to Expert-Tailored Solutions

See step-by-step solutions with expert insights and AI powered tools for academic success

Step: 2

blur-text-image

Step: 3

blur-text-image

Ace Your Homework with AI

Get the answers you need in no time with our AI-driven, step-by-step assistance

Get Started

Recommended Textbook for

Advances In Databases 28th British National Conference On Databases Bncod 28 Manchester Uk July 2011 Revised Selected Papers Lncs 7051

Authors: Alvaro A.A. Fernandes ,Alasdair J.G. Gray ,Khalid Belhajjame

2011th Edition

3642245765, 978-3642245763

More Books

Students also viewed these Databases questions

Question

What are negative messages? (Objective 1)

Answered: 1 week ago