

Answered step by step
Verified Expert Solution
Question
1 Approved Answer
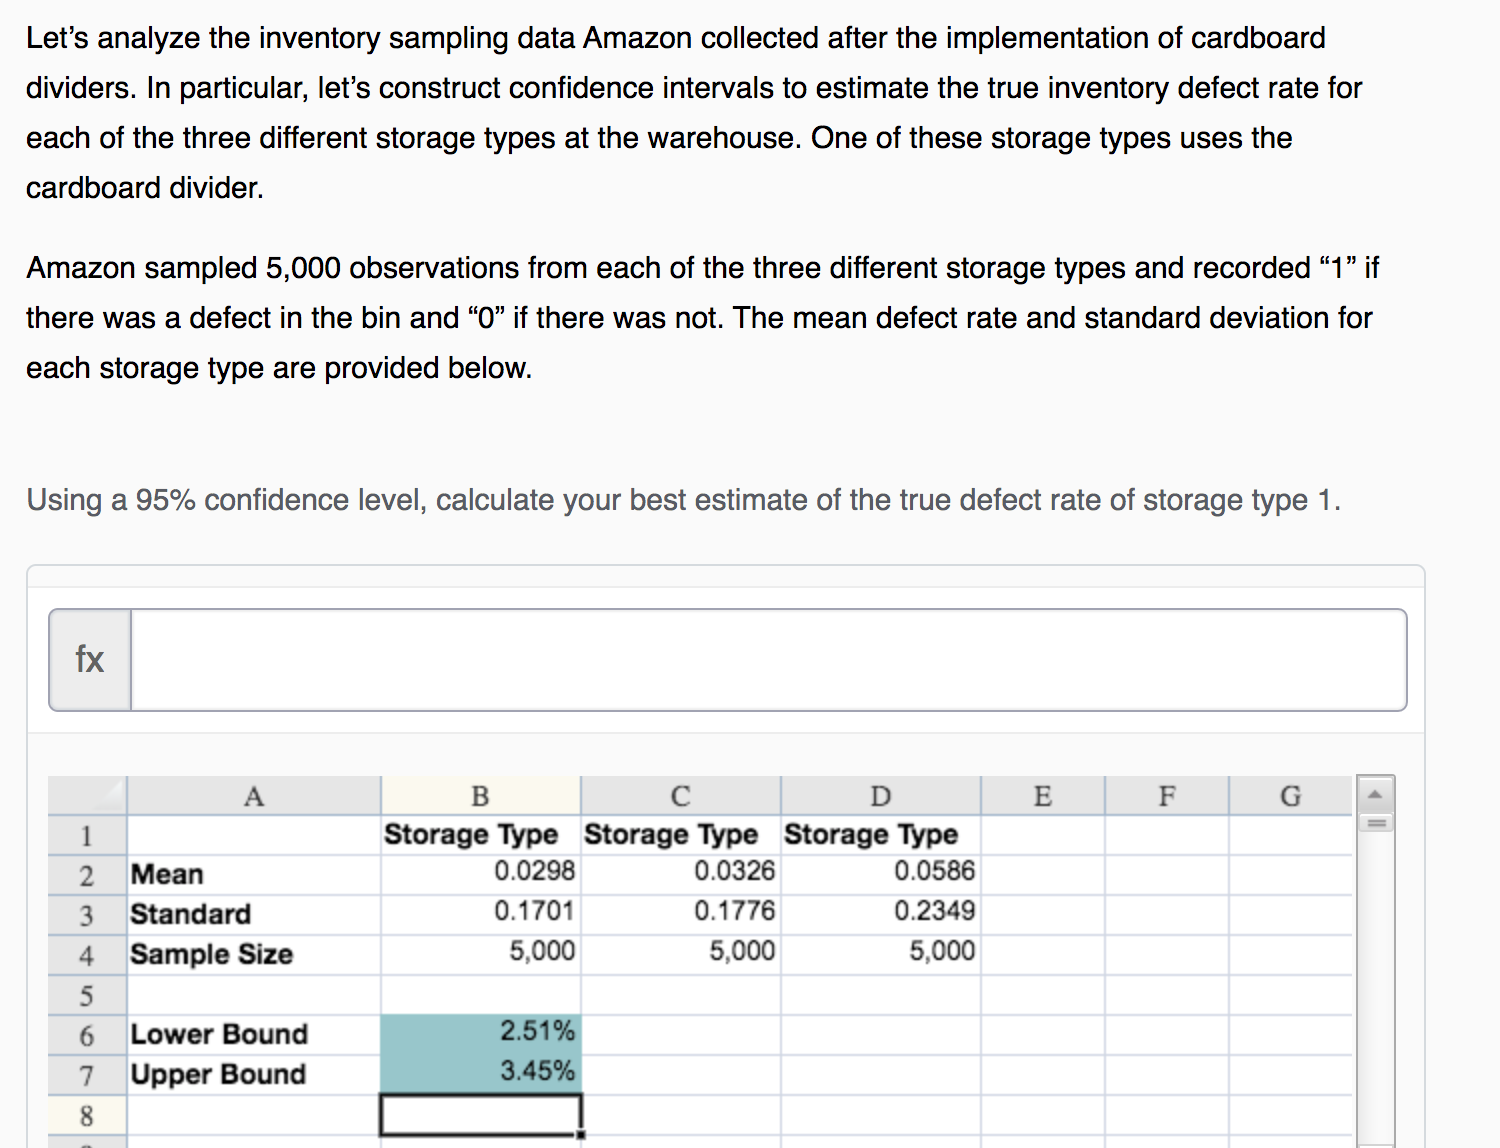
Let's analyze the inventory sampling data Amazon collected after the implementation of cardboard dividers. In particular, let's construct confidence intenrals to estimate the true inventory
Step by Step Solution
There are 3 Steps involved in it
Step: 1

Get Instant Access to Expert-Tailored Solutions
See step-by-step solutions with expert insights and AI powered tools for academic success
Step: 2

Step: 3
Ace Your Homework with AI
Get the answers you need in no time with our AI-driven, step-by-step assistance
Get Started
Macroeconomics Principles And Policy
Authors: William J. Baumol, Alan S. Blinder
11th Edition
0324586213, 978-0324586213