

Question
Let's assume that you've been hired by the President to solve the savings and loan crisis. As a first step, you decide to build a
Let's assume that you've been hired by the President to solve the savings and loan crisis. As a first step, you decide to build a model of how the industry worked before the crisis got started in the early 1980s. Your dependent variable is total deposits in passbook accounts (savings accounts) in Savings and Loan Associations (S & Ls) in the U.S. The data are quarterly for the 1970s, so there are 40 observations. For each quarter, the dependent variable, QDPASS, measures the quarterly (hence Q) aggregate current (nominal) dollars on deposits (D) in passbook (PASS) accounts in S & Ls in the U.S. Deposits in checking accounts, money market accounts, certificates of deposit, NOW accounts, commercial bank accounts, or brokerage house accounts are not included. Instead, QDPASS just measures the stock of deposits in traditional savings accounts in S & Ls. (The term "passbook" comes from the small books that often document such accounts.)
What is the basic financial theory on which a model of passbook deposits can be built? What kinds of variables should be considered for inclusion as explanatory variables? It's important to note that while they are called savings accounts by many people, passbook accounts should not be considered a measure of aggregate savings. Instead, the stock of passbook deposits is only one component of wealth. As such, the main theoretical work to be done before choosing variables should investigate how people decide what portion of their assets to keep in passbook accounts. The different levels of sophistication of such models in the literature are impressive, and any reader interested in reviewing a portion of the applicable articles should do so now before continuing on with the section.
If you were going to build a single-equation linear model of passbook deposits, what factors should you consider? During any quarter, new deposits can be generated by individuals wishing to save a portion of their income in that quarter, so any reasonable specification ought to include some measure of income or wealth. Two such variables are quarterly disposable income in the U.S. (QYDUS) and permanent income (QYPERM), defined below. Passbook savings accounts bear a lower rate of interest and are more liquid than almost any other financial asset except demand deposits (checking accounts), so there is some reason to believe that people might treat passbook holdings as interim transaction accounts. If this is true, then the income/wealth variables should be quite important.
A second set of important factors refers to competition from other assets and includes the interest rate on passbook accounts (QRDPASS), the interest rate on three-month Treasury bills (QRTB3Y), and a dummy variable (MMCDUM) equal to zero before the legalization in 1978 of money market certificates paying higher "money market" rates. In addition, a fourth variable, equal to the difference (SPREAD) between the two interest rate variables, can also be specified.
A third set of factors measures the environment in which the deposits are operating. If high inflation is expected, for example, holdings in all low-interest accounts might fall, so an "adaptive expectations" measure of expected inflation (EXPINF) is a possible explanatory variable. This measures last quarter's level of inflation; it's based on the theory that individuals form their expectation of future inflation rates by extrapolating from past inflation rates. In addition, the convenience of depositing funds may be relevant, so the total number of branches of S & Ls open nationwide (BRANCH) is also a possible variable.
To sum, the variables available for your model are:
QDPASSt = the aggregate stock of deposits held in passbook accounts in S & Ls in the U.S. in quarter t (millions of nominal dollars)
QYDUSt = U.S. disposable income in quarter t (millions of nominal dollars)
QYPERMt = U.S. "permanent" income in quarter t (millions of nominal dollars) (This variable was formed by taking a four-quarter declining weighted moving average of disposable income in previous quarters.)
QRDPASSt = the average rate of return (in percentage points) on passbook accounts in S & Ls in quarter t.
QRTB3Yt = the interest rate on three-month Treasury bills in quarter t
SPREADt = QRDPASSt QRTB3Yt
MMCDUMt = a dummy variable equal to zero before the third-quarter 1978 legalization of money market certificates and equal to one thereafter
EXPINFt = the expected percentage rate of inflation in quarter t (equal to the previous quarter's inflation rate)
BRANCHt = the number of S & L branches operating in the U.S. in quarter t
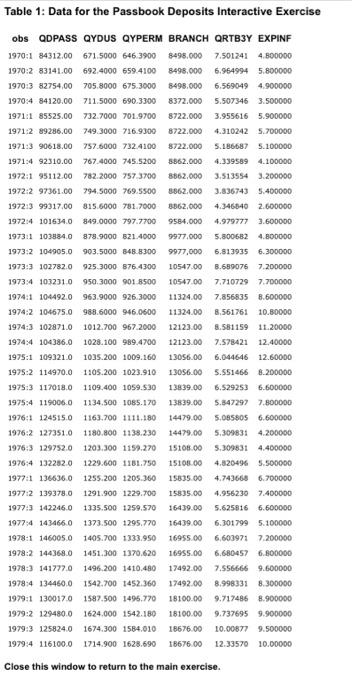
The data for these variables are contained in Table 1, but a few comments are in order. First, the data are quarterly from 1970 through 1979. More recent data are available, but the deregulation of the financial services industry makes that data not easily comparable to the data from the 1970s. Second, the interest rate on passbook accounts was controlled by "Regulation Q" and did not change much during the 1970s. In particular, QRDPASS was 5 percent until the fourth quarter of 1973, when it changed to 5.25 percent, where it remained until the third quarter of 1979 when it rose to 5.50 percent. Third, two of the variables were formed using data from previous quarters. QYPERM, a measure of "permanent" income, is a function of the four previous quarters' disposable income; this gives more weight to the last quarter than to quarters a year ago. EXPINF uses a simplified adaptive expectations model of the formation of inflationary expectations by using last quarter's inflation rate (specifically, the percentage rate of change of the fixed-weight GNP deflator) as the rate that will be expected. Finally, data on S & L branches (technically, total facilities) were not available for every quarter. While a smooth series could have been formed by interpolating between known observations to calculate the missing observations, we simply used the most recent known value as a proxy for the missing observations. As a result of the made-up nature of some of the observations of this variable, it will be potentially unreliable.
Now:
1. Hypothesize expected signs for the coefficients of all these variables in an equation for passbook deposits in the 1970s. Examine each variable carefully; what is the economic content of your hypothesis?
2. Choose carefully the best set of explanatory variables. Assume every model should have QYDUS and either the two interest rate variables or the spread variable. Don't simply include all the variables, intending to drop the insignificant ones. Instead, think through the problem carefully and find the best possible equation you can. For example, using SPREAD instead of both of the rate variables imposes a constraint on the interest rate coefficients; what is that constraint? Does the constraint make sense in our case? Why or why not? Or what about the permanent income hypothesis? Does it mean we should include QYPERM? Why or why not?
Step by Step Solution
There are 3 Steps involved in it
Step: 1

Get Instant Access to Expert-Tailored Solutions
See step-by-step solutions with expert insights and AI powered tools for academic success
Step: 2

Step: 3
Ace Your Homework with AI
Get the answers you need in no time with our AI-driven, step-by-step assistance
Get Started
The Cyber Attack Survival Manual
Authors: Heather Vescent ,Nick Selby
1st Edition
1681886545, 978-1681886541