

Question
Let's describe the relation between two characteristics.Run Excel Scatter Plot and Correlation for following pair of characteristics. Q_B.3. (10 pts) To verify common sense (faster
Let's describe the relation between two characteristics.Run Excel Scatter Plot and Correlation for following pair of characteristics.
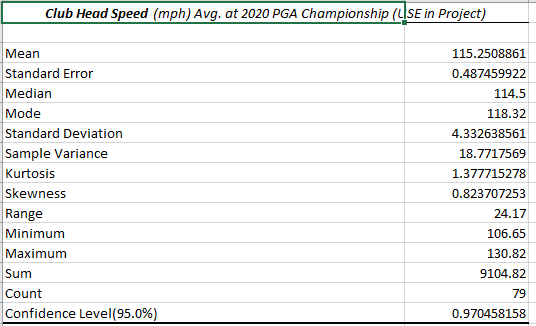
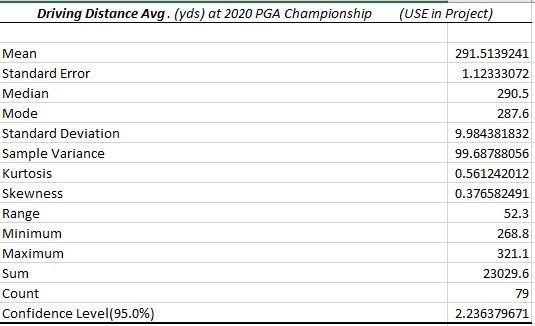
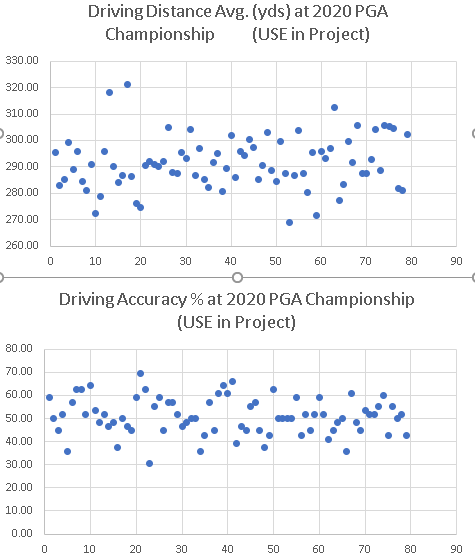
Q_B.3. (10 pts) To verify common sense (faster ball flies farther), check the relation between "Club Head Speed" and "Driving Distance" with Excel Scatter Plot and Correlation Coefficient.Using proper statistical terms, explain the relation between Club Head Speed and Driving Distance.
Q_B.4.(10 pts) Check the relation between "Club Head Speed" and "Driving Accuracy %" with Excel Scatter Plot and Correlation Coefficient.Using proper statistical terms, explain the relation between "Club Head Speed" and "Driving Accuracy %".
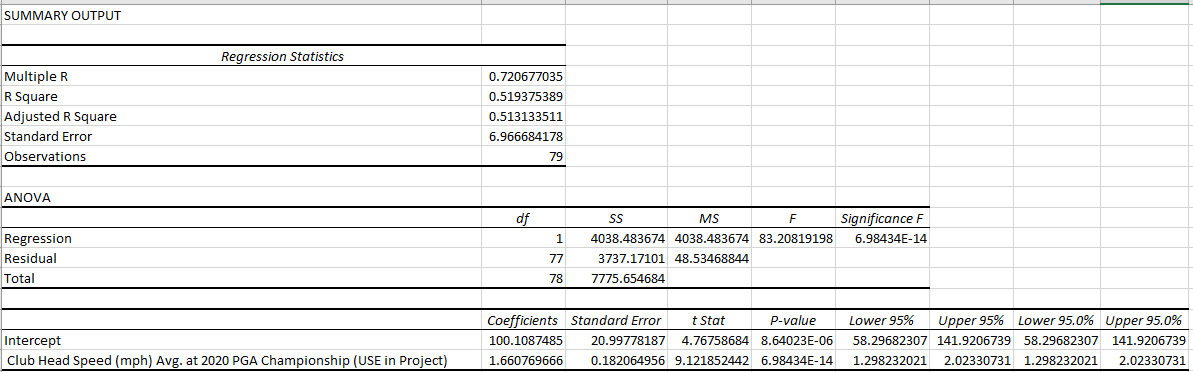
Have you observed approximately linear pattern from the scatter plots?Let's check more details on the relation.Using this data, consider the equation of the regression line,
y?=b0+b1x, for predicting the Driving Distance based on Club Head Speed.
Double check which (driving distance vs. club head speed) is X, which is Y.Critical!
(Assumptions about error term in simple linear regression are known to be satisfied).
Run Excel "regression" to predict Driving Distance based on Club Head Speed. Review output and answer following questions.
Q_B.5. Find the estimated y-intercept and estimated slope.Round your answer to three decimal places.
y-intercept:
slope:
Q_B.6. Write down the equation of the regression line, using the values in questions Q_B.4 and Q_B. 5.
Q_B.7. Is following statement TRUE or FALSE?Answer and explain reason.
"Not all points predicted by the linear model fall on the same line".
Q_B.8. According to the estimated linear model, when the club head speed is increased by one mile per hour, what happens to the estimated driver distance?
Q_B.9. Find the estimated driving distance when a player's club head speed is 110.00. Round your answer to three decimal places.
Q_B.10. Find the value of the coefficient of determination. Round your answer to three decimal places.Interpret the value.
Q_B.11. Let's say there is a player who just started practicing and his club head speed is 85 mph.Would it be reasonable to predict his driving distance using the regression model you figured out above? Why or why not?
Q_B.12. What is (are) the possible limit(s) of this simple linear regression analysis in predicting Driving Distance?


Step by Step Solution
There are 3 Steps involved in it
Step: 1

Get Instant Access to Expert-Tailored Solutions
See step-by-step solutions with expert insights and AI powered tools for academic success
Step: 2

Step: 3
Ace Your Homework with AI
Get the answers you need in no time with our AI-driven, step-by-step assistance
Get Started
Business Analytics Data Analysis and Decision Making
Authors: S. Christian Albright, Wayne L. Winston
5th edition
1133629601, 9781285965529 , 978-1133629603