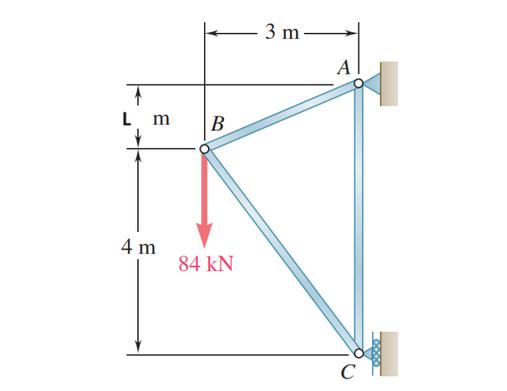
Question: Let's say that the internal forces in members AB, BC, CA are F1, F2, and F3 respectively. Plot F1, F2, and F3 as a


![import matplotlib.pyplot as plt # Sample data (replace these with your own data) x = [1, 2, 3, 4, 5] y1 = [2,](https://dsd5zvtm8ll6.cloudfront.net/si.experts.images/questions/2023/10/652a5b85eeb90_1697274756880.jpg)
Let's say that the internal forces in members AB, BC, CA are F1, F2, and F3 respectively. Plot F1, F2, and F3 as a function of L where L varies from 1.0 to 3.0. Here are the steps you need to take: 1. Determine the angle BAC in terms of L first 2. Draw the free body diagram at B. This would expose F1 and F2 and would allow you to solve for F1 ad F2 in terms of L and the 84kN force 3. Draw the free body diagram at C and solve for F3 4. F1, F2, and F3 will come out to be functions of L. Create plots for these in python. T L m 4 m B 84 KN 3 m A import matplotlib.pyplot as plt # Sample data (replace these with your own data) x = [1, 2, 3, 4, 5] y1 = [2, 3, 5, 7, 8] y2 = [1, 2, 4, 5, 6] y3 = [2.5, 2.8, 4.5, 4.8, 5.5] #Plotting the three variables plt.plot(x, yl, label='Variable y1', color='r', marker='0') plt.plot(x, y2, label='Variable y2', color='g', marker='x') plt.plot(x, y3, label='Variable y3', color='b', marker='s') # Setting the y-axis limit plt.ylim (0, 10) # This sets the y-axis limits to [0, 10]. # Adding title and labels plt.title('Plot of Three Variables') plt.xlabel('X-axis label') plt.ylabel('Y-axis label') # Showing the legend plt.legend() # Displaying the plot plt.grid(True) plt.tight_layout() plt.show()
Step by Step Solution
3.29 Rating (155 Votes )
There are 3 Steps involved in it
Certainly Heres an example implementation in Python that plots F1 F2 and F3 as functions of L python ... View full answer

Get step-by-step solutions from verified subject matter experts


