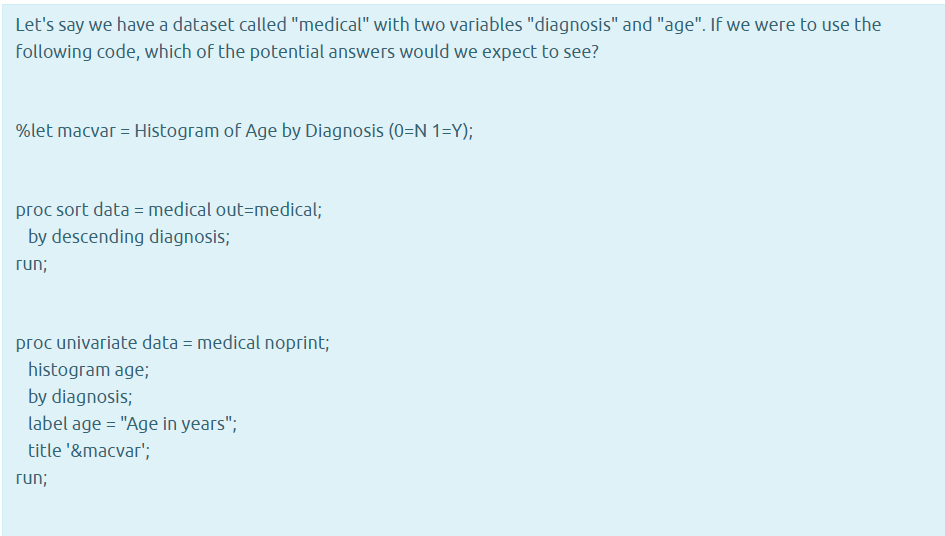
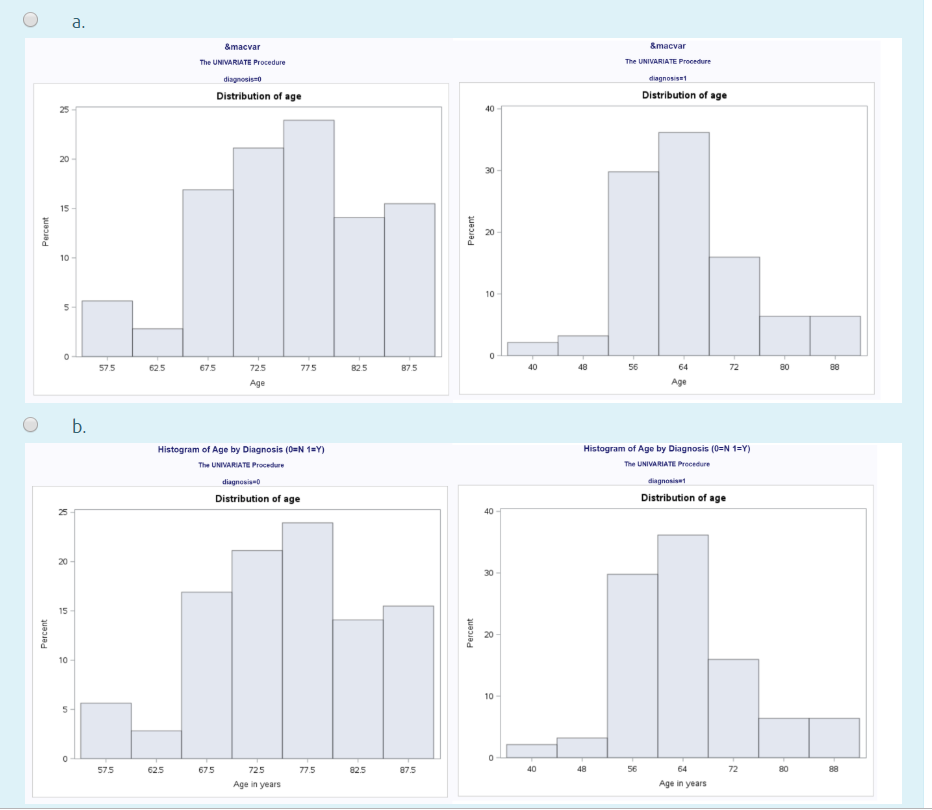
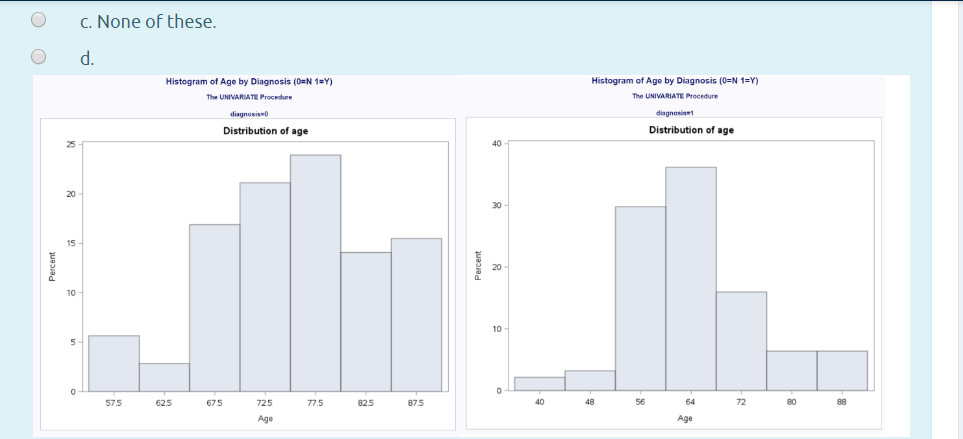
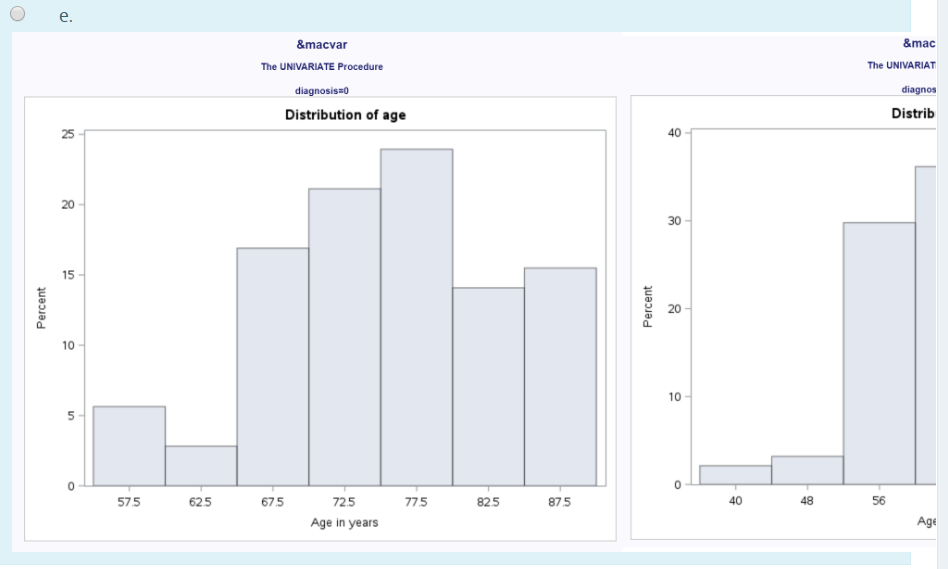
Let's say we have a dataset called "medical" with two variables "diagnosis" and "age". If we were to use the following code, which of the potential answers would we expect to see? %let macvar-Histogram of Age by Diagnosis (0-N 1-Y); proc sort data medical out-medical by descending diagnosis run, proc univariate data medical noprint; histogram age; by diagnosis label age "Age in years" title &macvar run, &macvar The UNIWARIATE Procedure The UNIVARIATE Procedure Distribution of age Distribution of age 15 10 10 57.5 62.5 675 725 775 82.5 87.5 64 80 Histogram of Age by Diagnosis (0 N 1Y) Histogram of Age by Diagnosis (0-N 1-Y) The UNIVARIATE Procedure The UNIVARIATE Procedure Distribution of age Distribution of age 25 15 10 575 675 725 77.5 82.5 875 72 Age in years Age in years O C. None of these d. Histogram of Age by Diagnosis (0 N 1-Y) The UNIWARIATE Procedure Histogram of Age by Diagnosis (0-N 1-Y The UNIVARIATE Procedure diagnosisnt Distribution of age Distribution of age 40 20 30 15 20 10 10 575 62.5 675 725 77.5 82.5 875 56 64 72 &macvar The UNIVARIATE Procedure diagnosis#0 &mac The UNIVARIAT diagnos Distrib Distribution of age 25 40- 20 30 15 9 20 10- 10 57.5 625 67.5 725 77.5 825 87.5 40 48 Age in years Age Let's say we have a dataset called "medical" with two variables "diagnosis" and "age". If we were to use the following code, which of the potential answers would we expect to see? %let macvar-Histogram of Age by Diagnosis (0-N 1-Y); proc sort data medical out-medical by descending diagnosis run, proc univariate data medical noprint; histogram age; by diagnosis label age "Age in years" title &macvar run, &macvar The UNIWARIATE Procedure The UNIVARIATE Procedure Distribution of age Distribution of age 15 10 10 57.5 62.5 675 725 775 82.5 87.5 64 80 Histogram of Age by Diagnosis (0 N 1Y) Histogram of Age by Diagnosis (0-N 1-Y) The UNIVARIATE Procedure The UNIVARIATE Procedure Distribution of age Distribution of age 25 15 10 575 675 725 77.5 82.5 875 72 Age in years Age in years O C. None of these d. Histogram of Age by Diagnosis (0 N 1-Y) The UNIWARIATE Procedure Histogram of Age by Diagnosis (0-N 1-Y The UNIVARIATE Procedure diagnosisnt Distribution of age Distribution of age 40 20 30 15 20 10 10 575 62.5 675 725 77.5 82.5 875 56 64 72 &macvar The UNIVARIATE Procedure diagnosis#0 &mac The UNIVARIAT diagnos Distrib Distribution of age 25 40- 20 30 15 9 20 10- 10 57.5 625 67.5 725 77.5 825 87.5 40 48 Age in years Age


