

Answered step by step
Verified Expert Solution
Question
1 Approved Answer
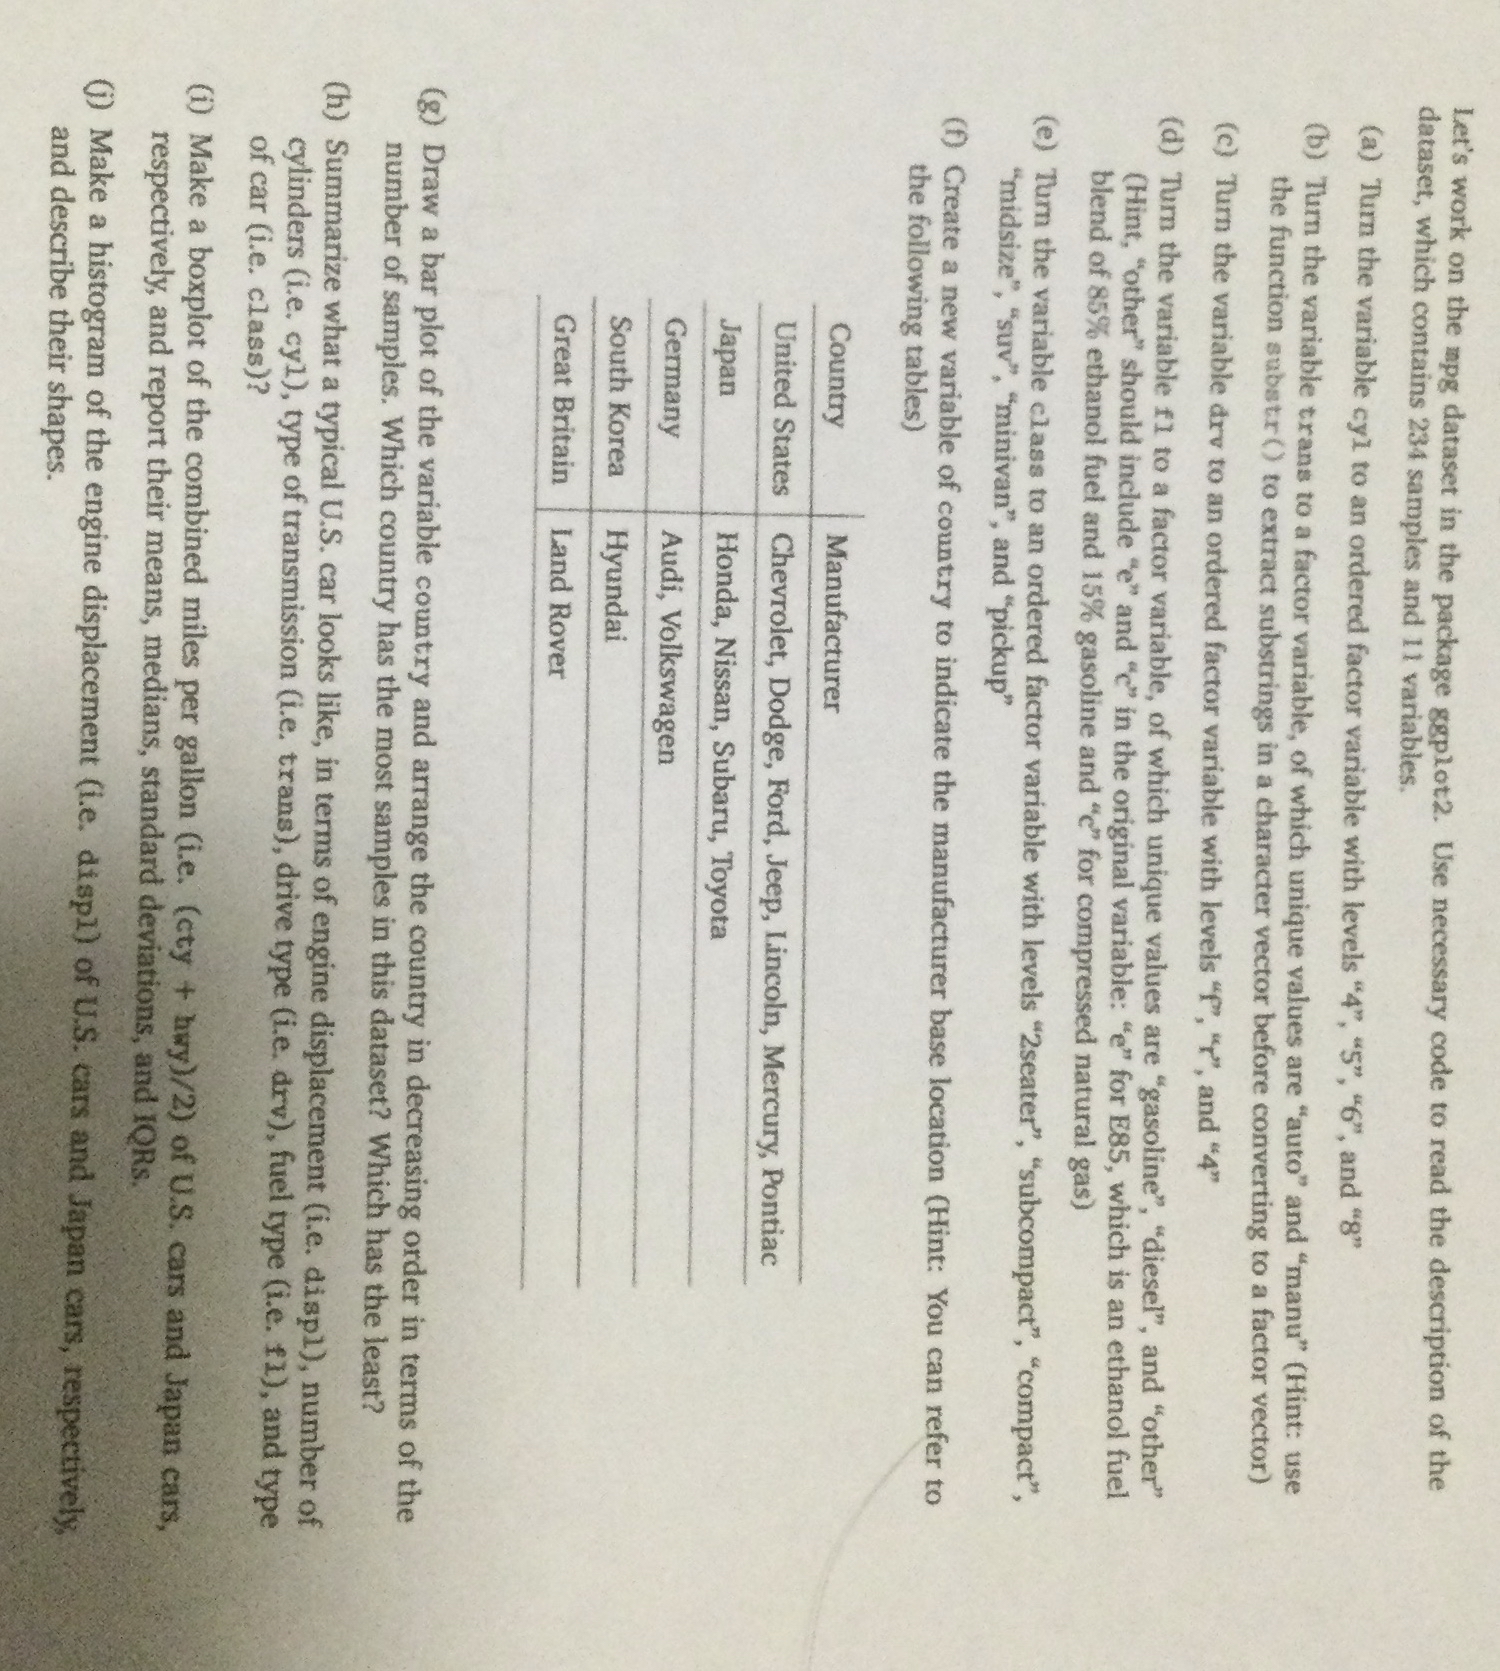
Let's work on the mpg dataset in the package ggplot 2 . Use necessary code to read the description of the dataset, which contains 2
Let's work on the mpg dataset in the package ggplot Use necessary code to read the description of the dataset, which contains samples and variables.
a Turn the variable cyi to an ordered factor variable with levels and
b Turn the variable trans to a factor variable, of which unique values are "auto" and "manu" Hint: use the function substr to extract substrings in a character vector before converting to a factor vector
c Turn the variable drv to an ordered factor variable with levels and
d Tum the variable to a factor variable, of which unique values are "gasoline", "diesel", and "other" Hint "other" should include and in the original variable: for E which is an ethanol fuel blend of ethanol fuel and gasoline and for compressed natural gas
e Tum the variable class to an ordered factor variable with levels seater", "subcompact", "compact", "midsize", "suv", "minivan", and "pickup"
f Create a new variable of country to indicate the manufacturer base location Hint: You can refer to the following tables
tableCountryManufacturerUnited States,Chevrolet, Dodge, Ford, Jeep, Lincoln, Mercury, PontiacJapanHonda, Nissan, Subaru, ToyotaGermanyAudi, VolkswagenSouth Korea,HyundaiGreat Britain,Land Rover
g Draw a bar plot of the variable country and arrange the country in decreasing order in terms of the number of samples. Which country has the most samples in this dataset? Which has the least?
h Summarize what a typical US car looks like, in terms of engine displacement ie displ number of cylinders ie cy type of transmission ie trans drive type ie drv fuel type ie fl and type of car ie class
i Make a boxplot of the combined miles per gallon iecty hwy of US cars and Japan cars, respectively, and report their means, medians, standard deviations, and IQRs.
j Make a histogram of the engine displacement ie dispI of US cars and Japan cars, respectively, and describe their shapes.
Step by Step Solution
There are 3 Steps involved in it
Step: 1

Get Instant Access to Expert-Tailored Solutions
See step-by-step solutions with expert insights and AI powered tools for academic success
Step: 2

Step: 3
Ace Your Homework with AI
Get the answers you need in no time with our AI-driven, step-by-step assistance
Get Started
Current Trends In Database Technology Edbt 2004 Workshops Edbt 2004 Workshops Phd Datax Pim P2panddb And Clustweb Heraklion Crete Greece March 2004 Revised Selected Papers Lncs 3268
Authors: Wolfgang Lindner ,Marco Mesiti ,Can Turker ,Yannis Tzitzikas ,Athena Vakali
2005th Edition
3540233059, 978-3540233053