Answered step by step
Verified Expert Solution
Question
1 Approved Answer
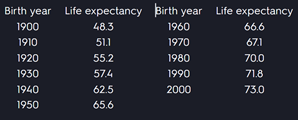
Life expectancy improved dramatically in the 20th century. The table gives the life expectancy at birth (in years) of males born in the United States.

Life expectancy improved dramatically in the 20th century. The table gives the life expectancy at birth (in years) of males born in the United States. Use a scatter plot (in matlab)to choose an appropriate type of model. Use your model to predict the life-span of a male born in the year 2010. USING MATLAB!
Birth year 1900 1910 1920 1930 1940 1950 Life expectancy Birth year 48.3 1960 51.1 1970 55.2 1980 57.4 1990 62.5 2000 65.6 Life expectancy 66.6 671 70.0 71.8 73.0Step by Step Solution
There are 3 Steps involved in it
Step: 1

Get Instant Access to Expert-Tailored Solutions
See step-by-step solutions with expert insights and AI powered tools for academic success
Step: 2

Step: 3

Ace Your Homework with AI
Get the answers you need in no time with our AI-driven, step-by-step assistance
Get Started


