

Answered step by step
Verified Expert Solution
Question
1 Approved Answer
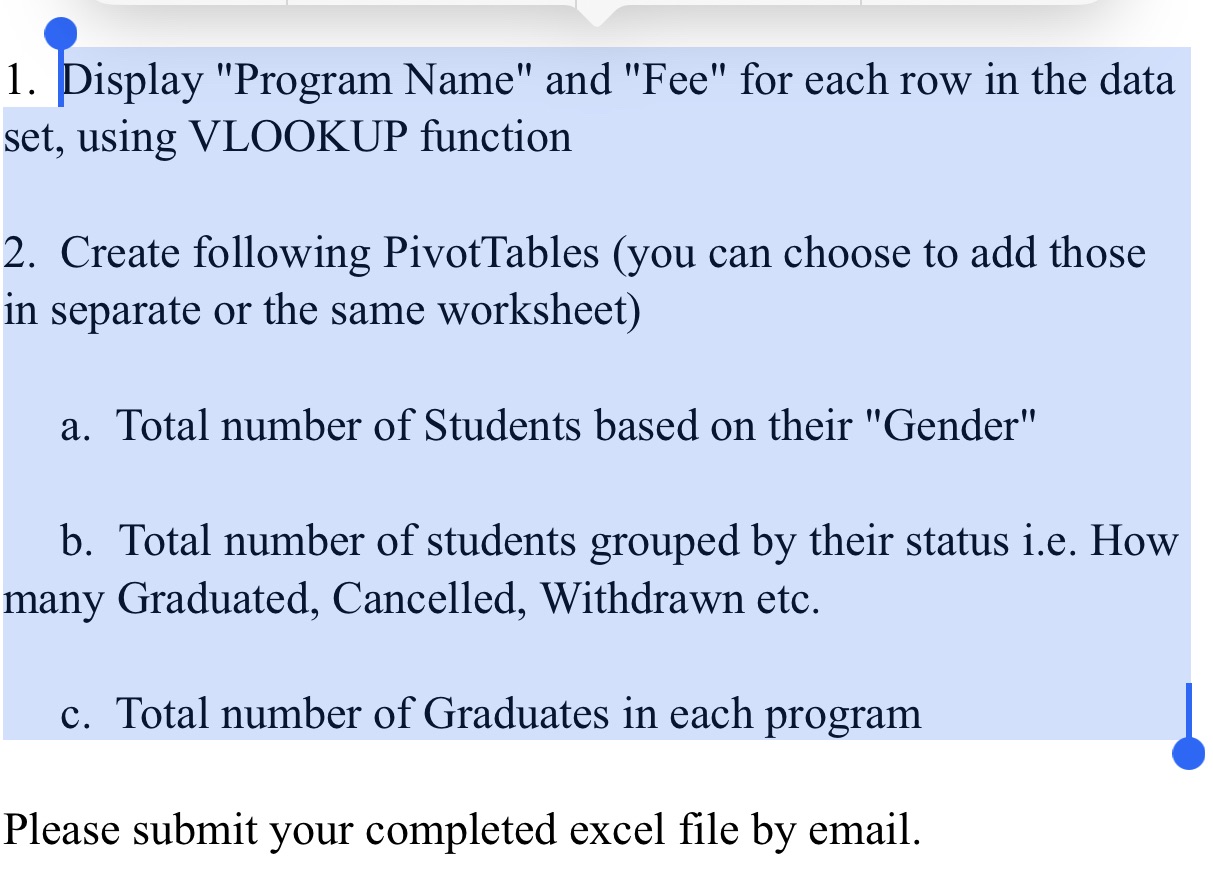
l.I)isplay Program Name and Fee for each row in the data set, using VLOOKUP function 2. Create following PivotTables (you can choose to add those
Step by Step Solution
There are 3 Steps involved in it
Step: 1

Get Instant Access to Expert-Tailored Solutions
See step-by-step solutions with expert insights and AI powered tools for academic success
Step: 2

Step: 3
Ace Your Homework with AI
Get the answers you need in no time with our AI-driven, step-by-step assistance
Get Started
Transport Operations
Authors: Allen Stuart
2nd Edition
978-0470115398, 0470115394