

Question
Lina purchased a new car for use in her business during 2019. The auto was the only business asset she purchased during the year and
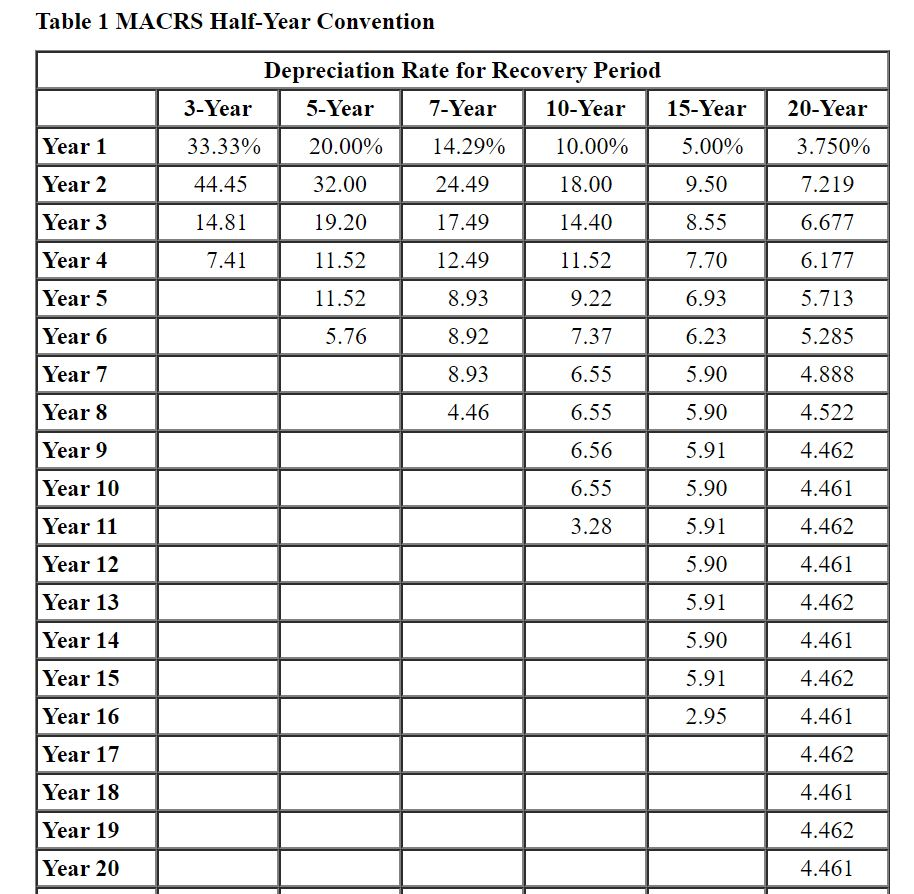
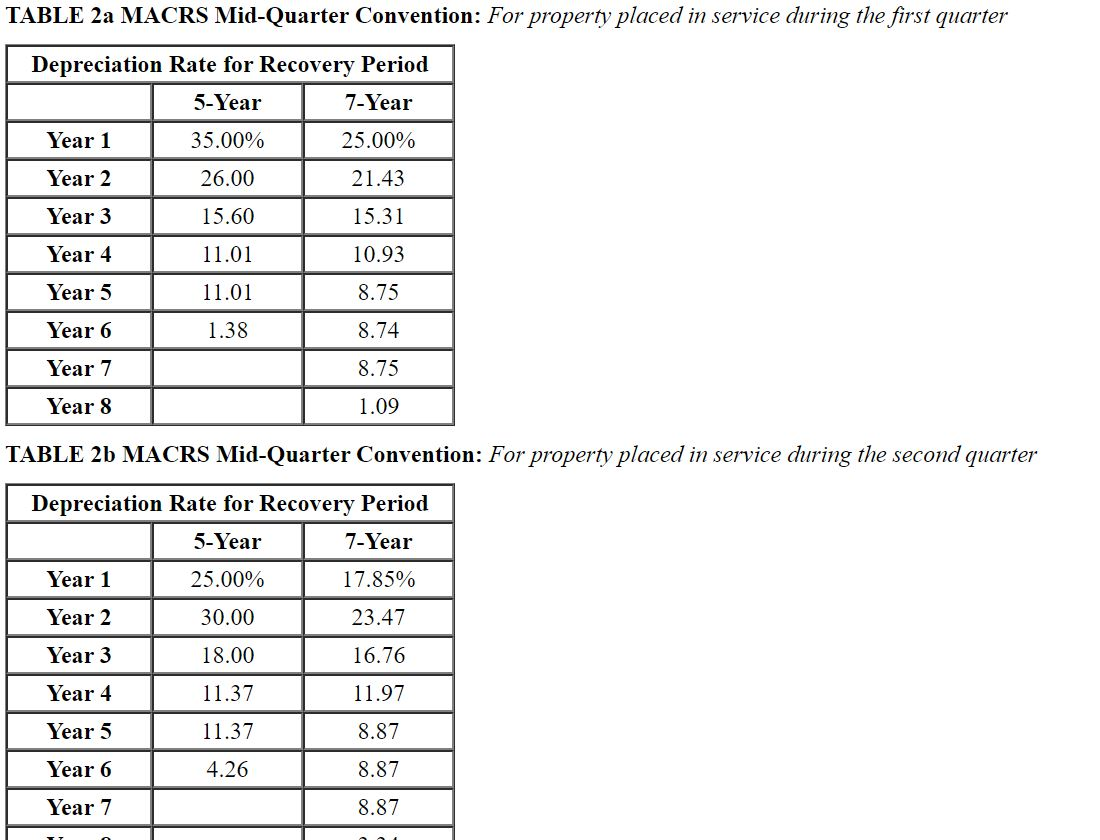
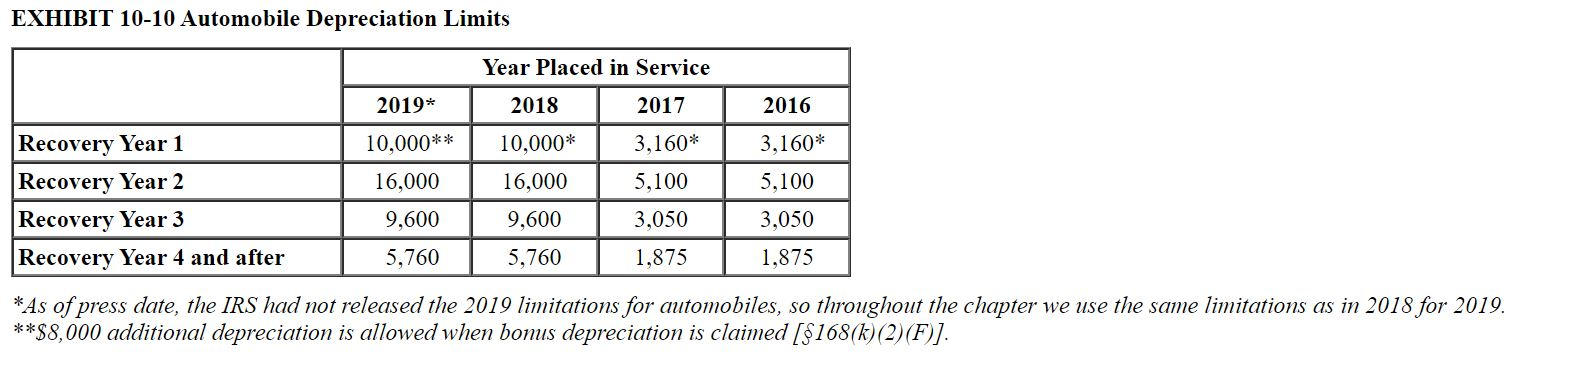 Lina purchased a new car for use in her business during 2019. The auto was the only business asset she purchased during the year and her business was extremely profitable. Calculate her maximum depreciation deductions (including 179 expense unless stated otherwise) for the automobile in 2019 and 2020 (Lina doesnt want to take bonus depreciation for 2019 or 2020) in the following alternative scenarios (assuming half-year convention for all): (Use MACRS Table 1, Table 2, and Exhibit 10-10.)
d. The vehicle cost $83,000, and she used it 80 percent for business. She sold it on March 1 of year 2. e. The vehicle cost $83,000, and she used it 20 percent for business
f. The vehicle cost $83,000, and is an SUV that weighs 6,500 pounds. Business use was 100 percent.
Table 1 MACRS Half-Year Convention Year 1 Year 2 15-Year 5.00% 9.50 8.55 7.70 Year 3 Year 4 Year 5 Depreciation Rate for Recovery Period 3-Year 5-Year 7-Year 10-Year 33.33% 20.00% 14.29% 10.00% 44.45 32.00 24.49 18.00 14.81 19.20 17.49 14.40 7.41 11.52 12.49 11.52 11.52 8.93 9.22 5.76 8.92 7.37 8.93 6.55 4.46 6.55 6.56 6.55 3.28 6.93 Year 6 6.23 5.90 5.90 5.91 5.90 5.91 5.90 Year 7 Year 8 Year 9 Year 10 Year 11 Year 12 Year 13 Year 14 Year 15 Year 16 Year 17 Year 18 Year 19 Year 20 20-Year 3.750% 7.219 6.677 6.177 5.713 5.285 4.888 4.522 4.462 4.461 4.462 4.461 4.462 4.461 4.462 5.91 5.90 5.91 2.95 4.461 4.462 4.461 4.462 4.461 TABLE 2a MACRS Mid-Quarter Convention: For property placed in service during the first quarter Depreciation Rate for Recovery Period 5-Year 7-Year Year 1 35.00% 25.00% Year 2 26.00 21.43 Year 3 15.60 15.31 Year 4 11.01 10.93 Year 5 11.01 8.75 Year 6 1.38 8.74 Year 7 8.75 Year 8 1.09 TABLE 2b MACRS Mid-Quarter Convention: For property placed in service during the second quarter Depreciation Rate for Recovery Period 5-Year 7-Year Year 1 1 25.00% 17.85% Year 2 1 30.00 23.47 Year 3 18.00 16.76 Year 4 11.37 11.97 Year 5 11.37 8.87 Year 6 4.26 8.87 1 Year 7 8.87 T7 EXHIBIT 10-10 Automobile Depreciation Limits 2019* 2016 Recovery Year 1 Recovery Year 2 Recovery Year 3 Recovery Year 4 and after 10,000** 16,000 9,600 5,760 Year Placed in Service 2018 2017 10,000* 3,160* 16,000 5,100 9,600 3,050 5,760 1,875 3,160* 5,100 3,050 1,875 *As of press date, the IRS had not released the 2019 limitations for automobiles, so throughout the chapter we use the same limitations as in 2018 for 2019. **$8,000 additional depreciation is allowed when bonus depreciation is claimed ($168(k) (2) (F) Table 1 MACRS Half-Year Convention Year 1 Year 2 15-Year 5.00% 9.50 8.55 7.70 Year 3 Year 4 Year 5 Depreciation Rate for Recovery Period 3-Year 5-Year 7-Year 10-Year 33.33% 20.00% 14.29% 10.00% 44.45 32.00 24.49 18.00 14.81 19.20 17.49 14.40 7.41 11.52 12.49 11.52 11.52 8.93 9.22 5.76 8.92 7.37 8.93 6.55 4.46 6.55 6.56 6.55 3.28 6.93 Year 6 6.23 5.90 5.90 5.91 5.90 5.91 5.90 Year 7 Year 8 Year 9 Year 10 Year 11 Year 12 Year 13 Year 14 Year 15 Year 16 Year 17 Year 18 Year 19 Year 20 20-Year 3.750% 7.219 6.677 6.177 5.713 5.285 4.888 4.522 4.462 4.461 4.462 4.461 4.462 4.461 4.462 5.91 5.90 5.91 2.95 4.461 4.462 4.461 4.462 4.461 TABLE 2a MACRS Mid-Quarter Convention: For property placed in service during the first quarter Depreciation Rate for Recovery Period 5-Year 7-Year Year 1 35.00% 25.00% Year 2 26.00 21.43 Year 3 15.60 15.31 Year 4 11.01 10.93 Year 5 11.01 8.75 Year 6 1.38 8.74 Year 7 8.75 Year 8 1.09 TABLE 2b MACRS Mid-Quarter Convention: For property placed in service during the second quarter Depreciation Rate for Recovery Period 5-Year 7-Year Year 1 1 25.00% 17.85% Year 2 1 30.00 23.47 Year 3 18.00 16.76 Year 4 11.37 11.97 Year 5 11.37 8.87 Year 6 4.26 8.87 1 Year 7 8.87 T7 EXHIBIT 10-10 Automobile Depreciation Limits 2019* 2016 Recovery Year 1 Recovery Year 2 Recovery Year 3 Recovery Year 4 and after 10,000** 16,000 9,600 5,760 Year Placed in Service 2018 2017 10,000* 3,160* 16,000 5,100 9,600 3,050 5,760 1,875 3,160* 5,100 3,050 1,875 *As of press date, the IRS had not released the 2019 limitations for automobiles, so throughout the chapter we use the same limitations as in 2018 for 2019. **$8,000 additional depreciation is allowed when bonus depreciation is claimed ($168(k) (2) (F)Step by Step Solution
There are 3 Steps involved in it
Step: 1

Get Instant Access to Expert-Tailored Solutions
See step-by-step solutions with expert insights and AI powered tools for academic success
Step: 2

Step: 3
Ace Your Homework with AI
Get the answers you need in no time with our AI-driven, step-by-step assistance
Get Started
Introduction to Managerial Accounting
Authors: Peter Brewer, Ray Garrison, Eric Noreen
7th edition
978-1259675539, 125967553X, 978-1259594168, 1259594165, 78025796, 978-0078025792