Answered step by step
Verified Expert Solution
Link Copied!

Question

1 Approved Answer

Linear regression analysis Consider the auto dataset below. I want to build a simple linear regression predicting mpg as a y variable (SAS code, please).
Linear regression analysis

  • Consider the auto dataset below.

I want to build a simple linear regression predicting mpg as a y variable (SAS code, please).

image text in transcribed
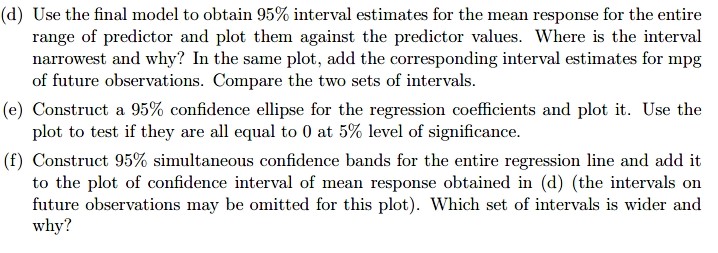
(d) Use the final model to obtain 95% interval estimates for the mean response for the entire range of predictor and plot them against the predictor values. Where is the interval narrowest and why? In the same plot, add the corresponding interval estimates for mpg of future observations. Compare the two sets of intervals. (e) Construct a 95% confidence ellipse for the regression coefficients and plot it. Use the plot to test if they are all equal to 0 at 5% level of significance. (f) Construct 95% simultaneous confidence bands for the entire regression line and add it to the plot of confidence interval of mean response obtained in (d) (the intervals on future observations may be omitted for this plot). Which set of intervals is wider and why

Step by Step Solution

There are 3 Steps involved in it

Step: 1

blur-text-image

Get Instant Access to Expert-Tailored Solutions

See step-by-step solutions with expert insights and AI powered tools for academic success

Step: 2

blur-text-image

Step: 3

blur-text-image

Ace Your Homework with AI

Get the answers you need in no time with our AI-driven, step-by-step assistance

Get Started

Recommended Textbook for

A First Course in Differential Equations with Modeling Applications

Authors: Dennis G. Zill

11th edition

1305965728, 978-1305965720

More Books

Students also viewed these Mathematics questions