Answered step by step
Verified Expert Solution
Link Copied!

Question

1 Approved Answer

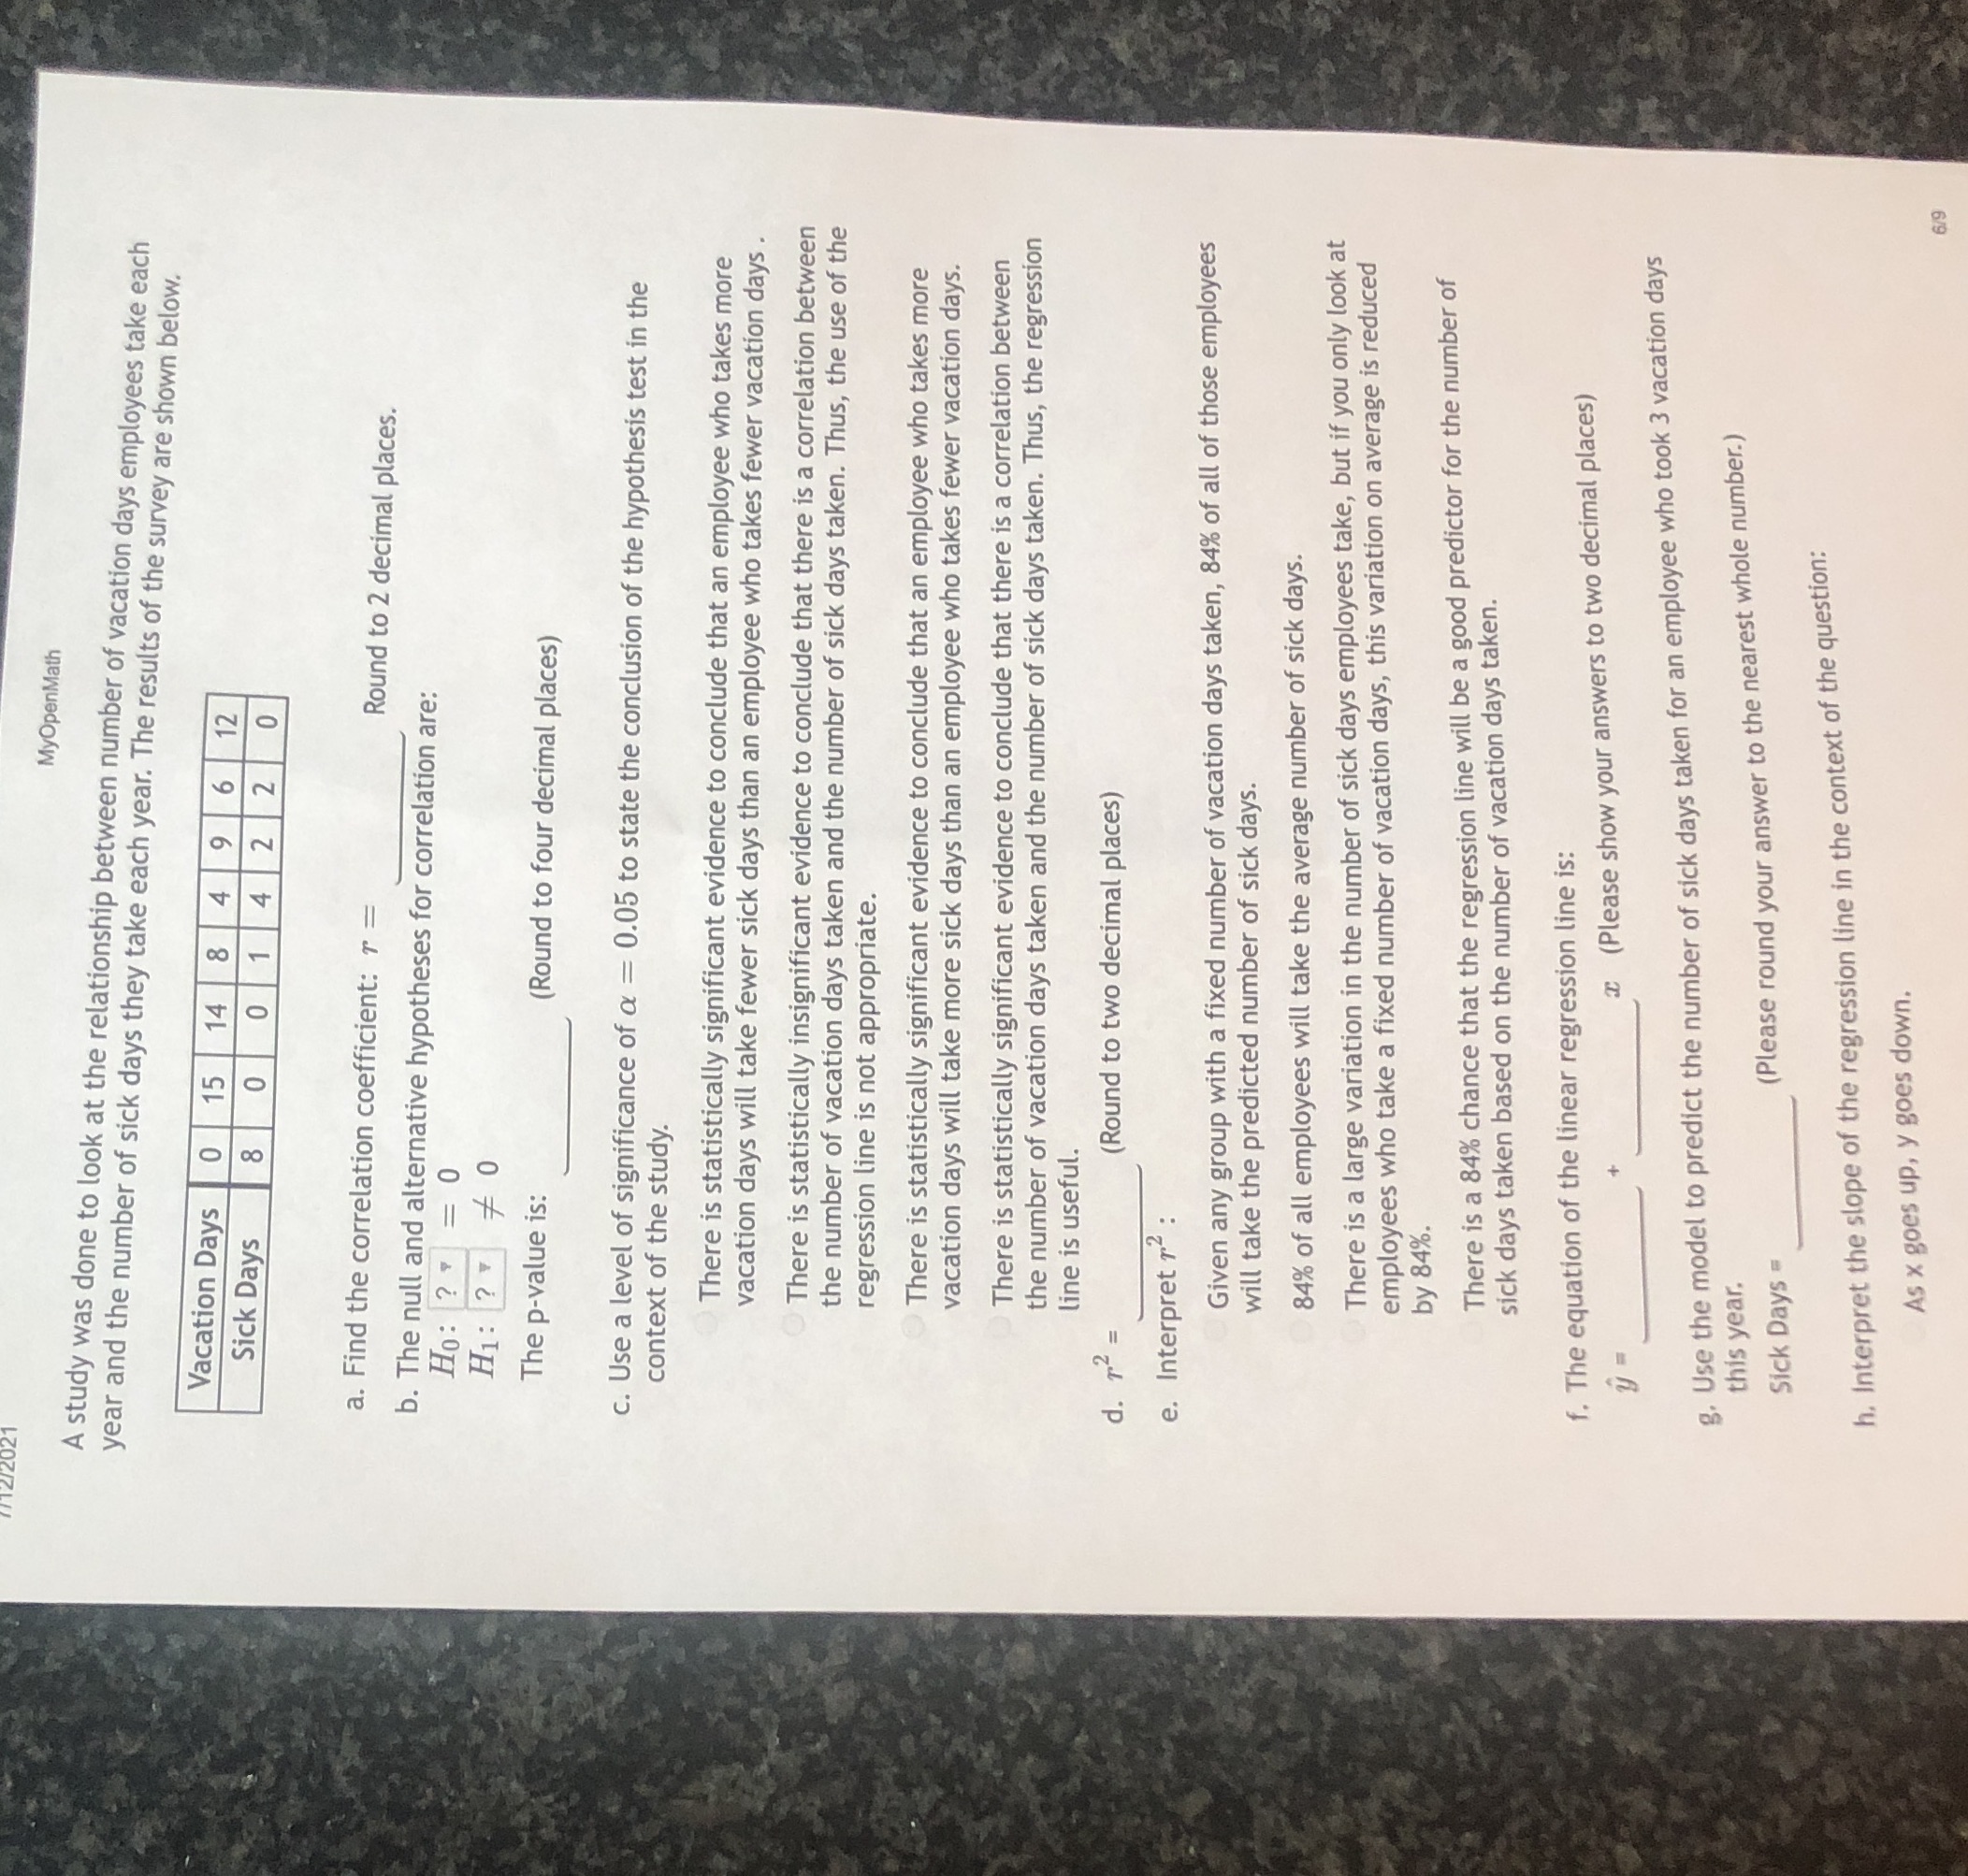
Linear regression MyOpenMath A study was done to look at the relationship between number of vacation days employees take each year and the number of

Linear regression

image text in transcribed
MyOpenMath A study was done to look at the relationship between number of vacation days employees take each year and the number of sick days they take each year. The results of the survey are shown below. Vacation Days 0 15 14 8 4 9 6 12 Sick Days 8 0 0 1 4 2 2 0 a. Find the correlation coefficient: r = Round to 2 decimal places. b. The null and alternative hypotheses for correlation are: Ho: ? " = 0 H1: ? * 0 The p-value is: (Round to four decimal places) c. Use a level of significance of a = 0.05 to state the conclusion of the hypothesis test in the context of the study. There is statistically significant evidence to conclude that an employee who takes more vacation days will take fewer sick days than an employee who takes fewer vacation days . There is statistically insignificant evidence to conclude that there is a correlation between the number of vacation days taken and the number of sick days taken. Thus, the use of the regression line is not appropriate. There is statistically significant evidence to conclude that an employee who takes more vacation days will take more sick days than an employee who takes fewer vacation days. There is statistically significant evidence to conclude that there is a correlation between the number of vacation days taken and the number of sick days taken. Thus, the regression line is useful. d. r2 = (Round to two decimal places) e. Interpret r2 : Given any group with a fixed number of vacation days taken, 84% of all of those employees will take the predicted number of sick days. 84%% of all employees will take the average number of sick days. There is a large variation in the number of sick days employees take, but if you only look at employees who take a fixed number of vacation days, this variation on average is reduced by 84%. There is a 84% chance that the regression line will be a good predictor for the number of sick days taken based on the number of vacation days taken. f. The equation of the linear regression line is: x (Please show your answers to two decimal places) g. Use the model to predict the number of sick days taken for an employee who took 3 vacation days this year. (Please round your answer to the nearest whole number.) Sick Days = h. Interpret the slope of the regression line in the context of the question: As x goes up, y goes down. 6/9

Step by Step Solution

There are 3 Steps involved in it

Step: 1

blur-text-image

Get Instant Access to Expert-Tailored Solutions

See step-by-step solutions with expert insights and AI powered tools for academic success

Step: 2

blur-text-image

Step: 3

blur-text-image

Ace Your Homework with AI

Get the answers you need in no time with our AI-driven, step-by-step assistance

Get Started

Recommended Textbook for

Discrete Mathematics

Authors: Gary Chartrand, Ping Zhang

1st Edition

1478616261, 9781478616269

More Books

Students also viewed these Mathematics questions

Question

What are your options besides a rote memory approach?

Answered: 1 week ago