Answered step by step
Verified Expert Solution
Link Copied!

Question

1 Approved Answer

Linear Regression: size (square footage) vs- selling price (thousands of dollars). size (sqft)=51.215 Selling price=311,000 The pictures are of my data and information I need

Linear Regression: size (square footage) vs- selling price (thousands of dollars). size (sqft)=51.215 Selling price=311,000

The pictures are of my data and information I need help with.

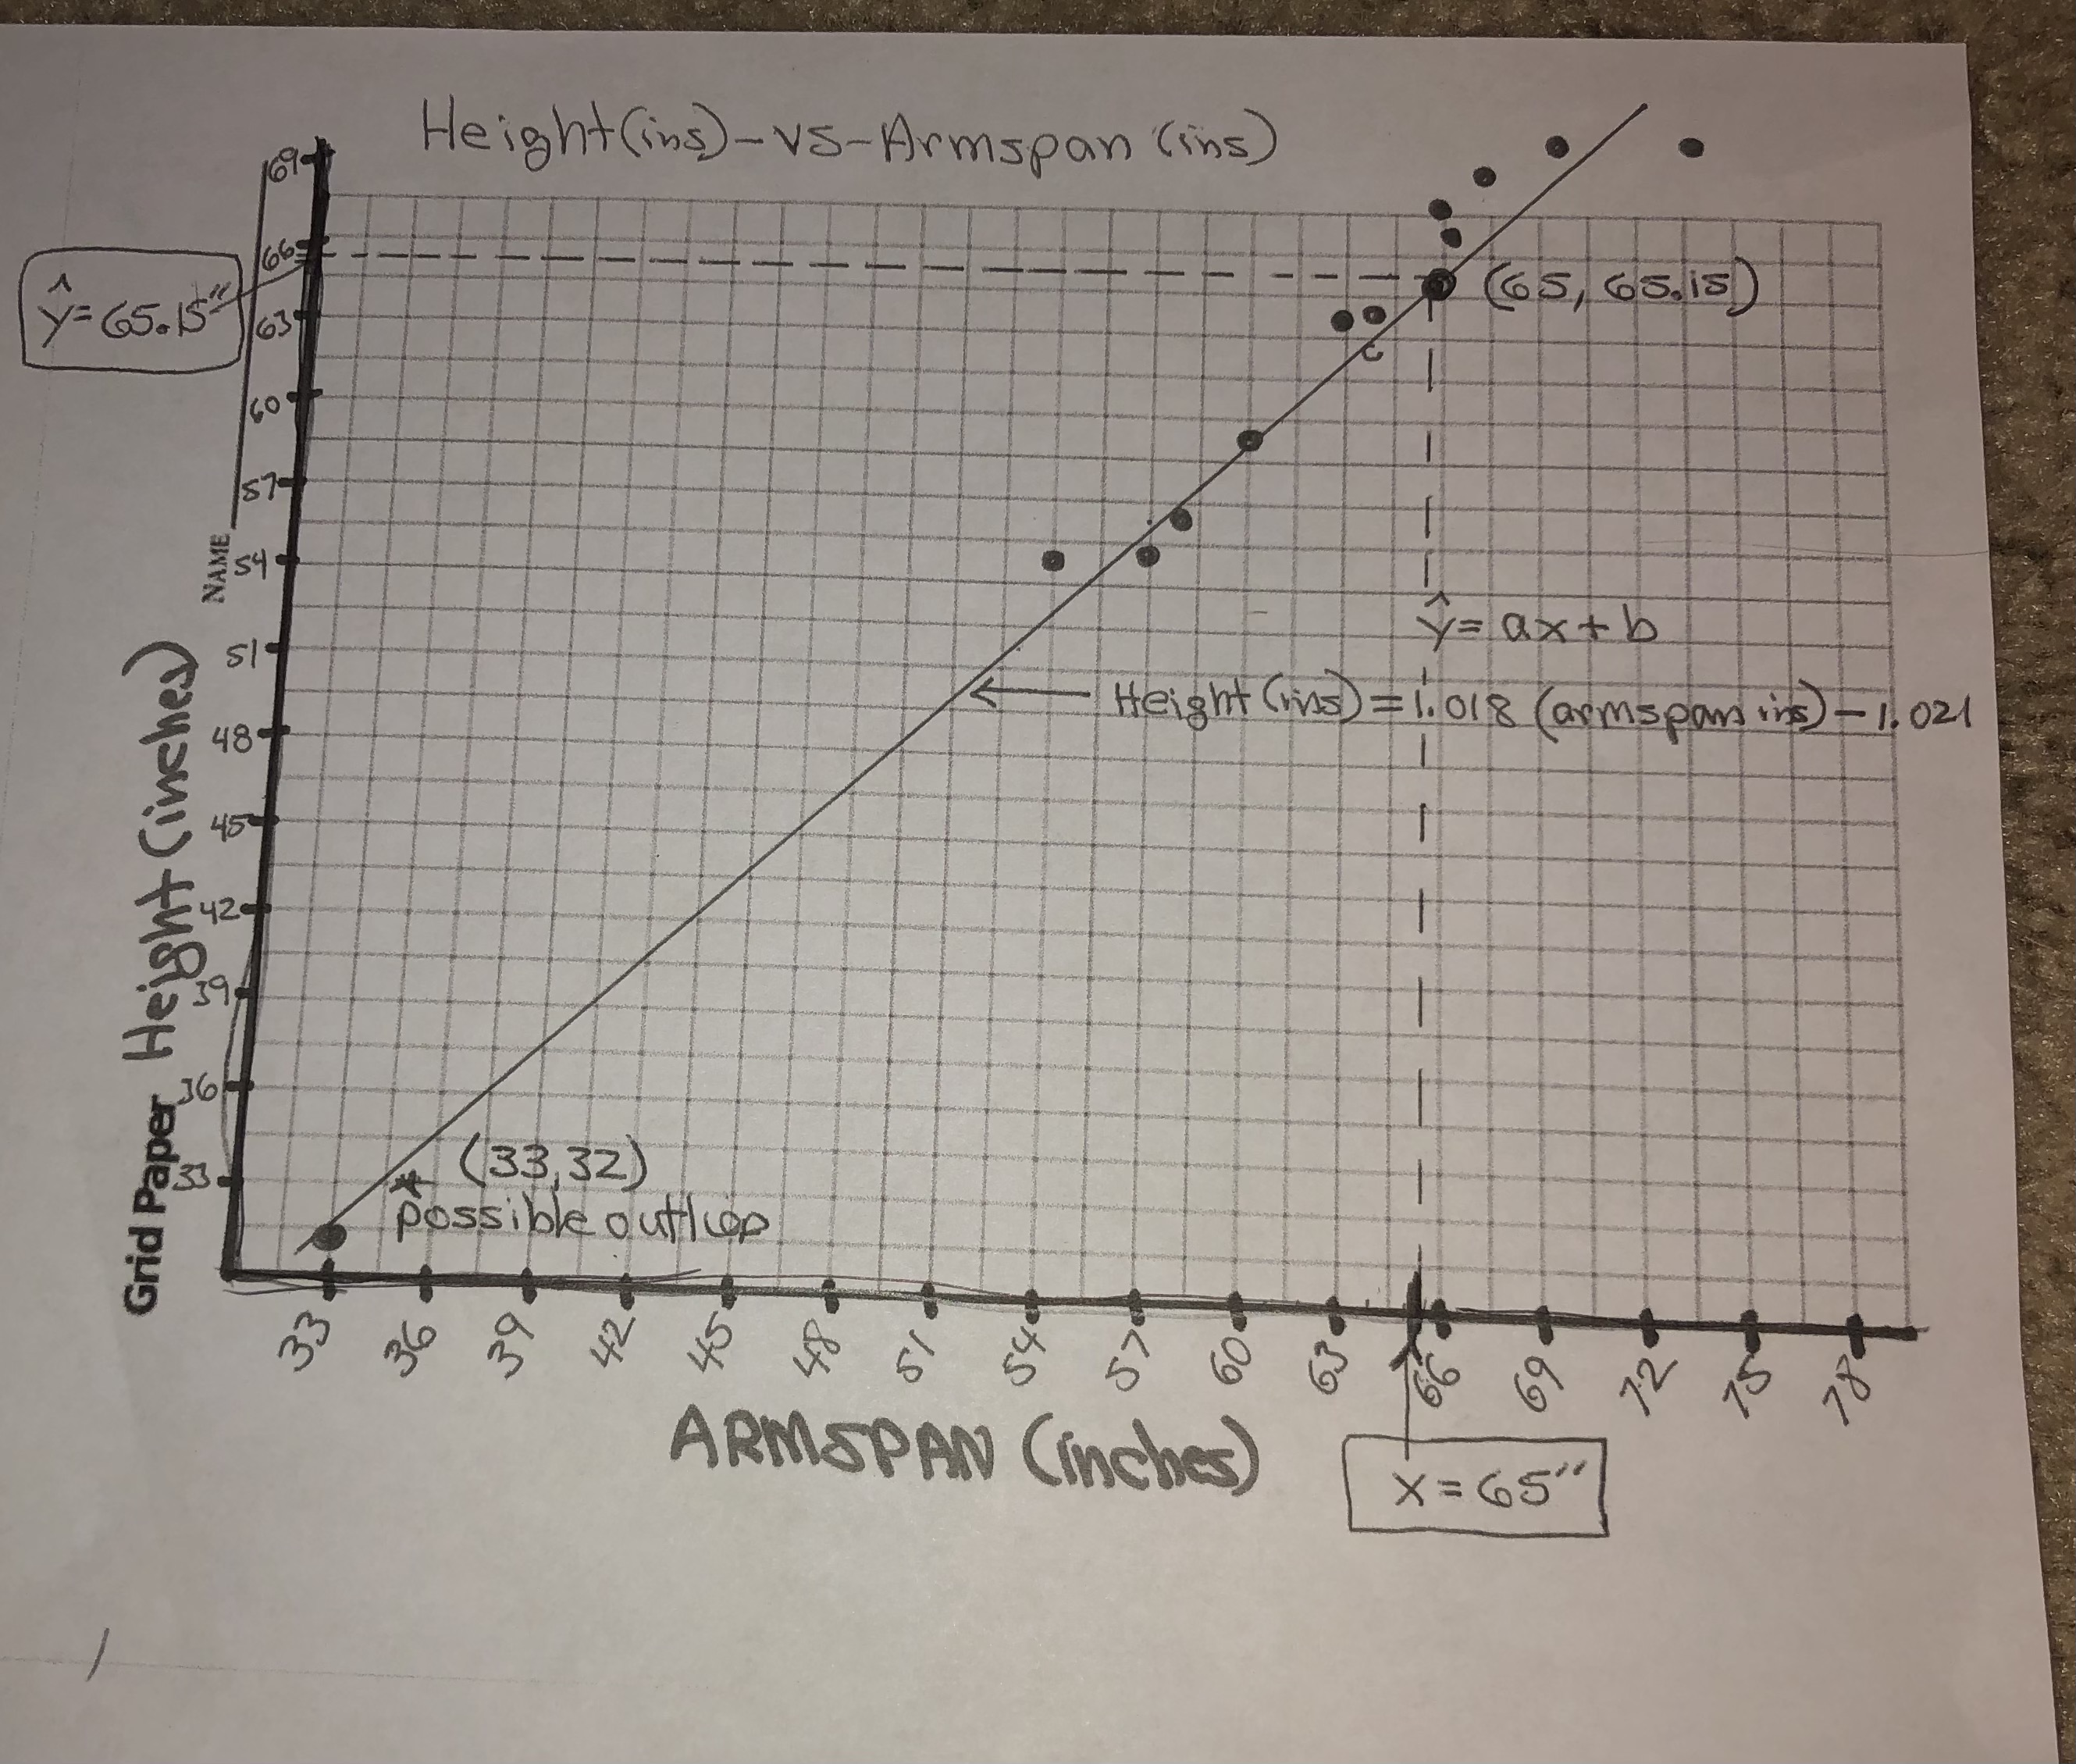
the image of the graph is just an example of what my graph should kind of look like, but with my information from the data table of size vs selling price.
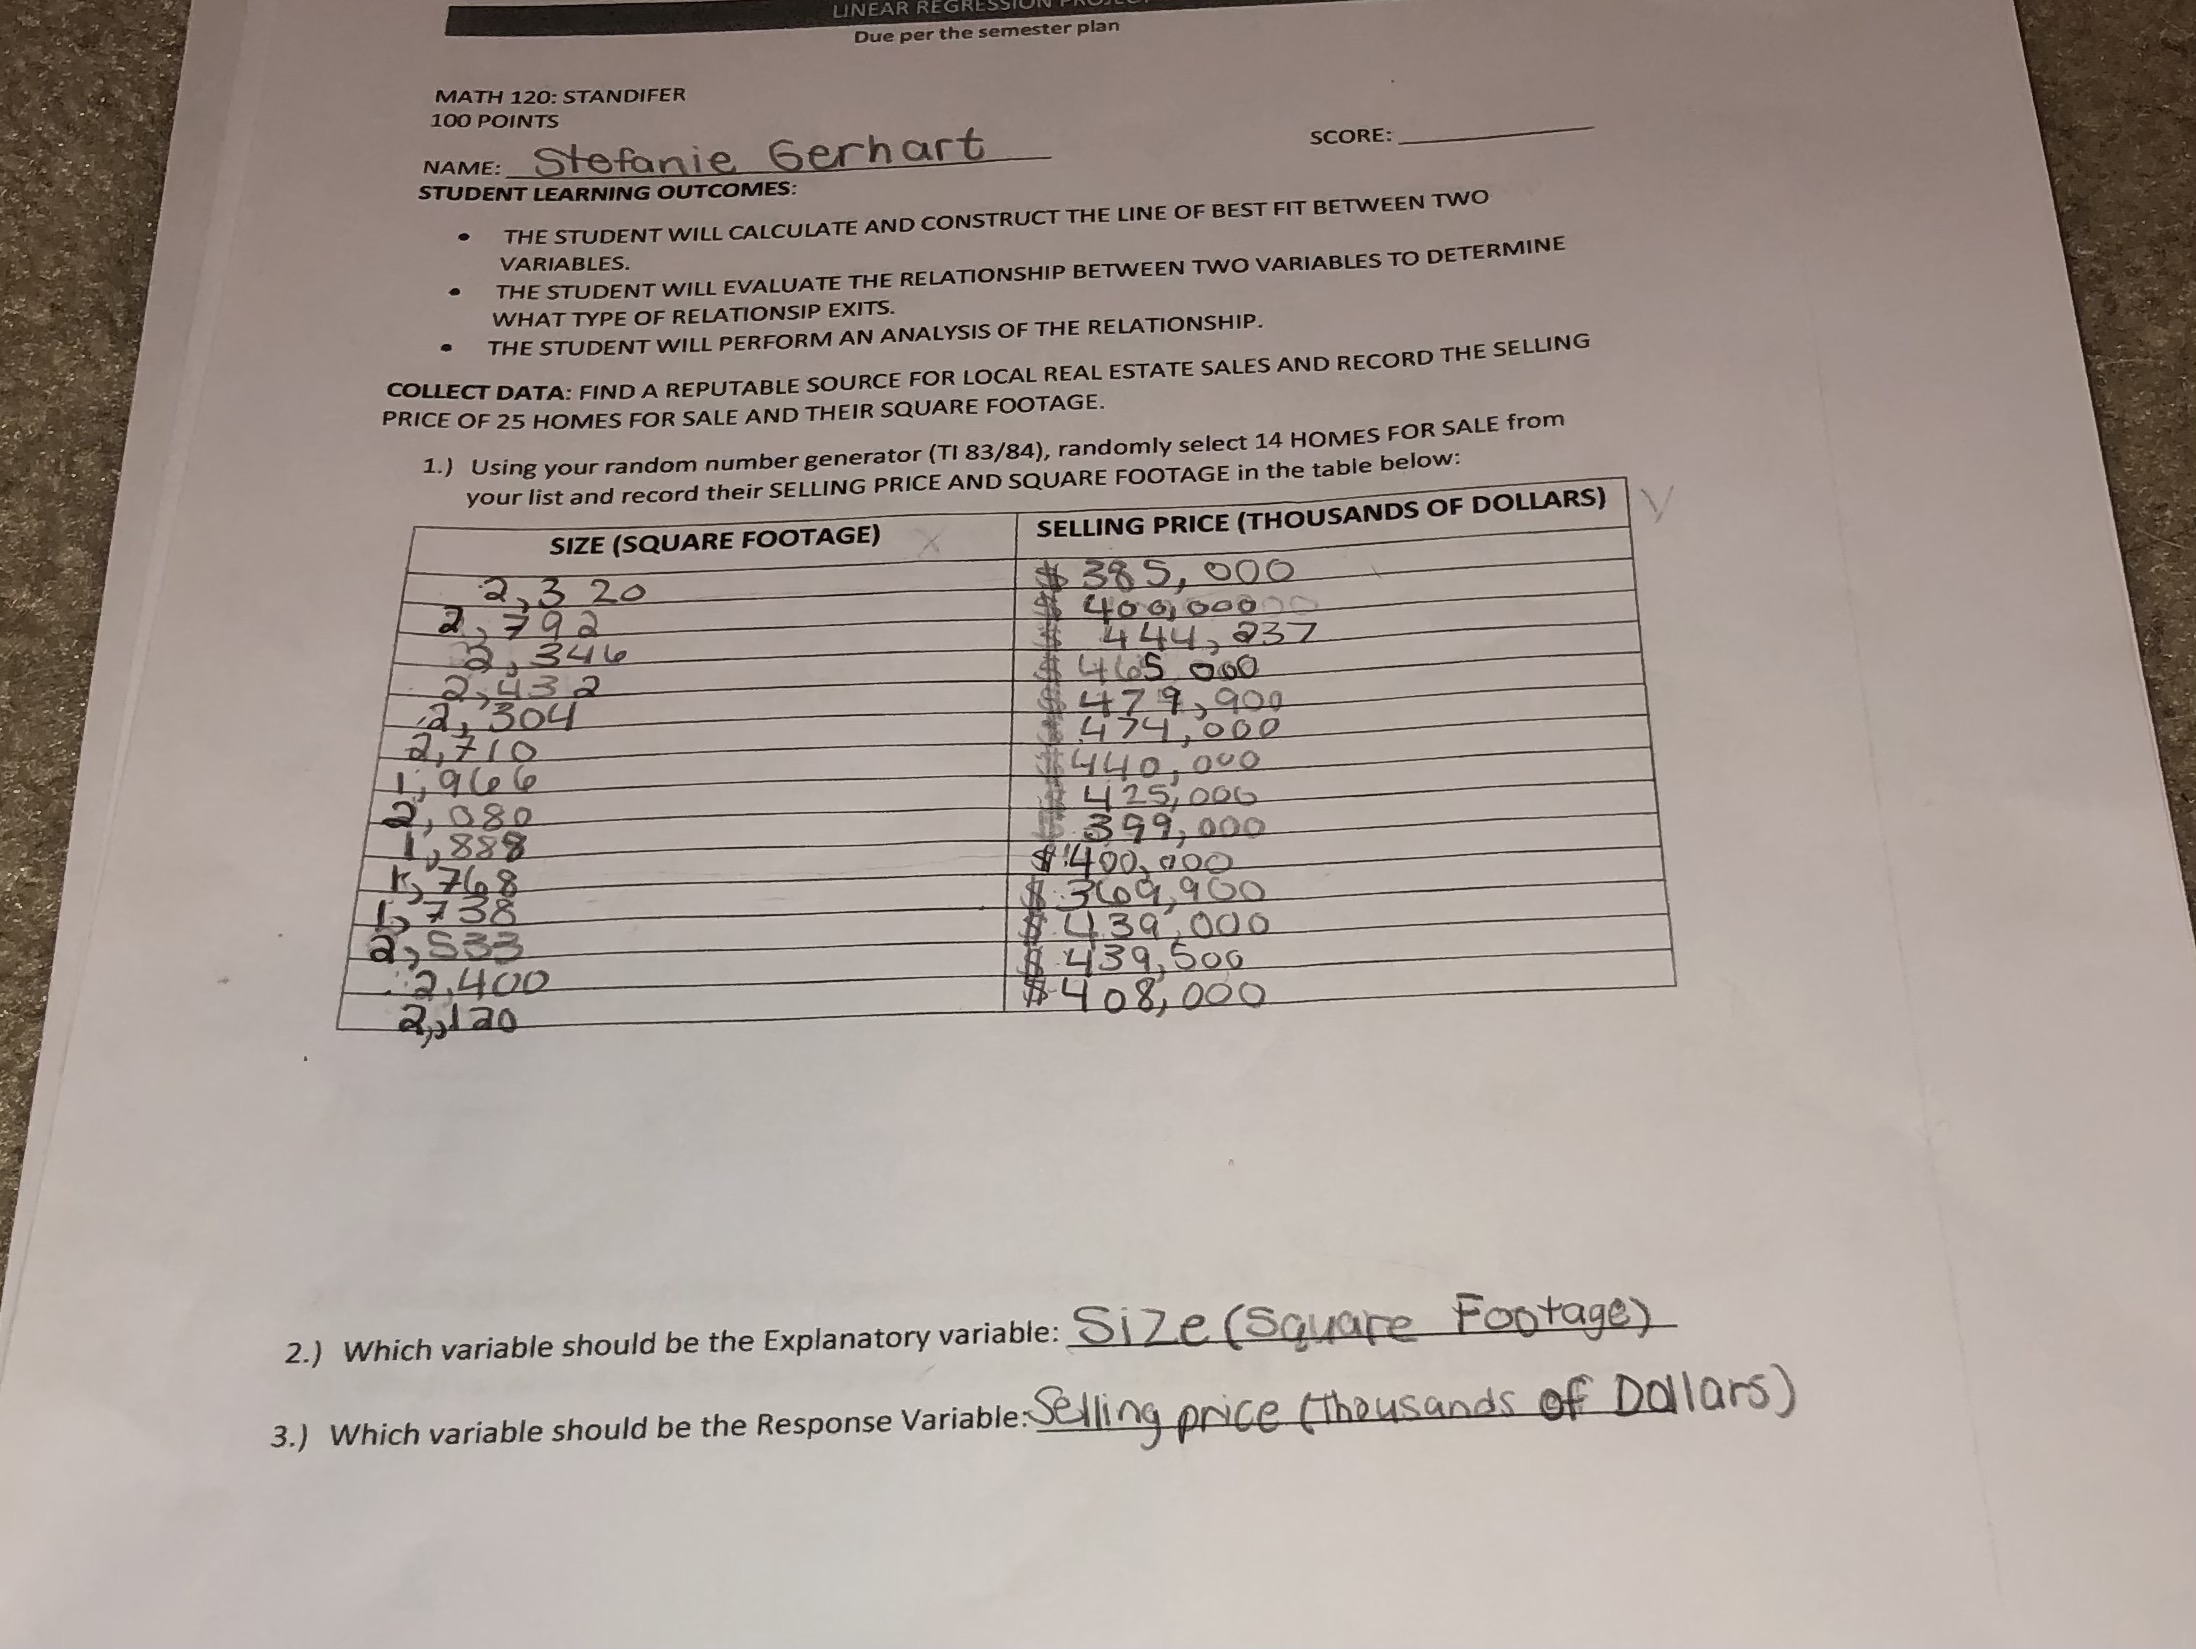
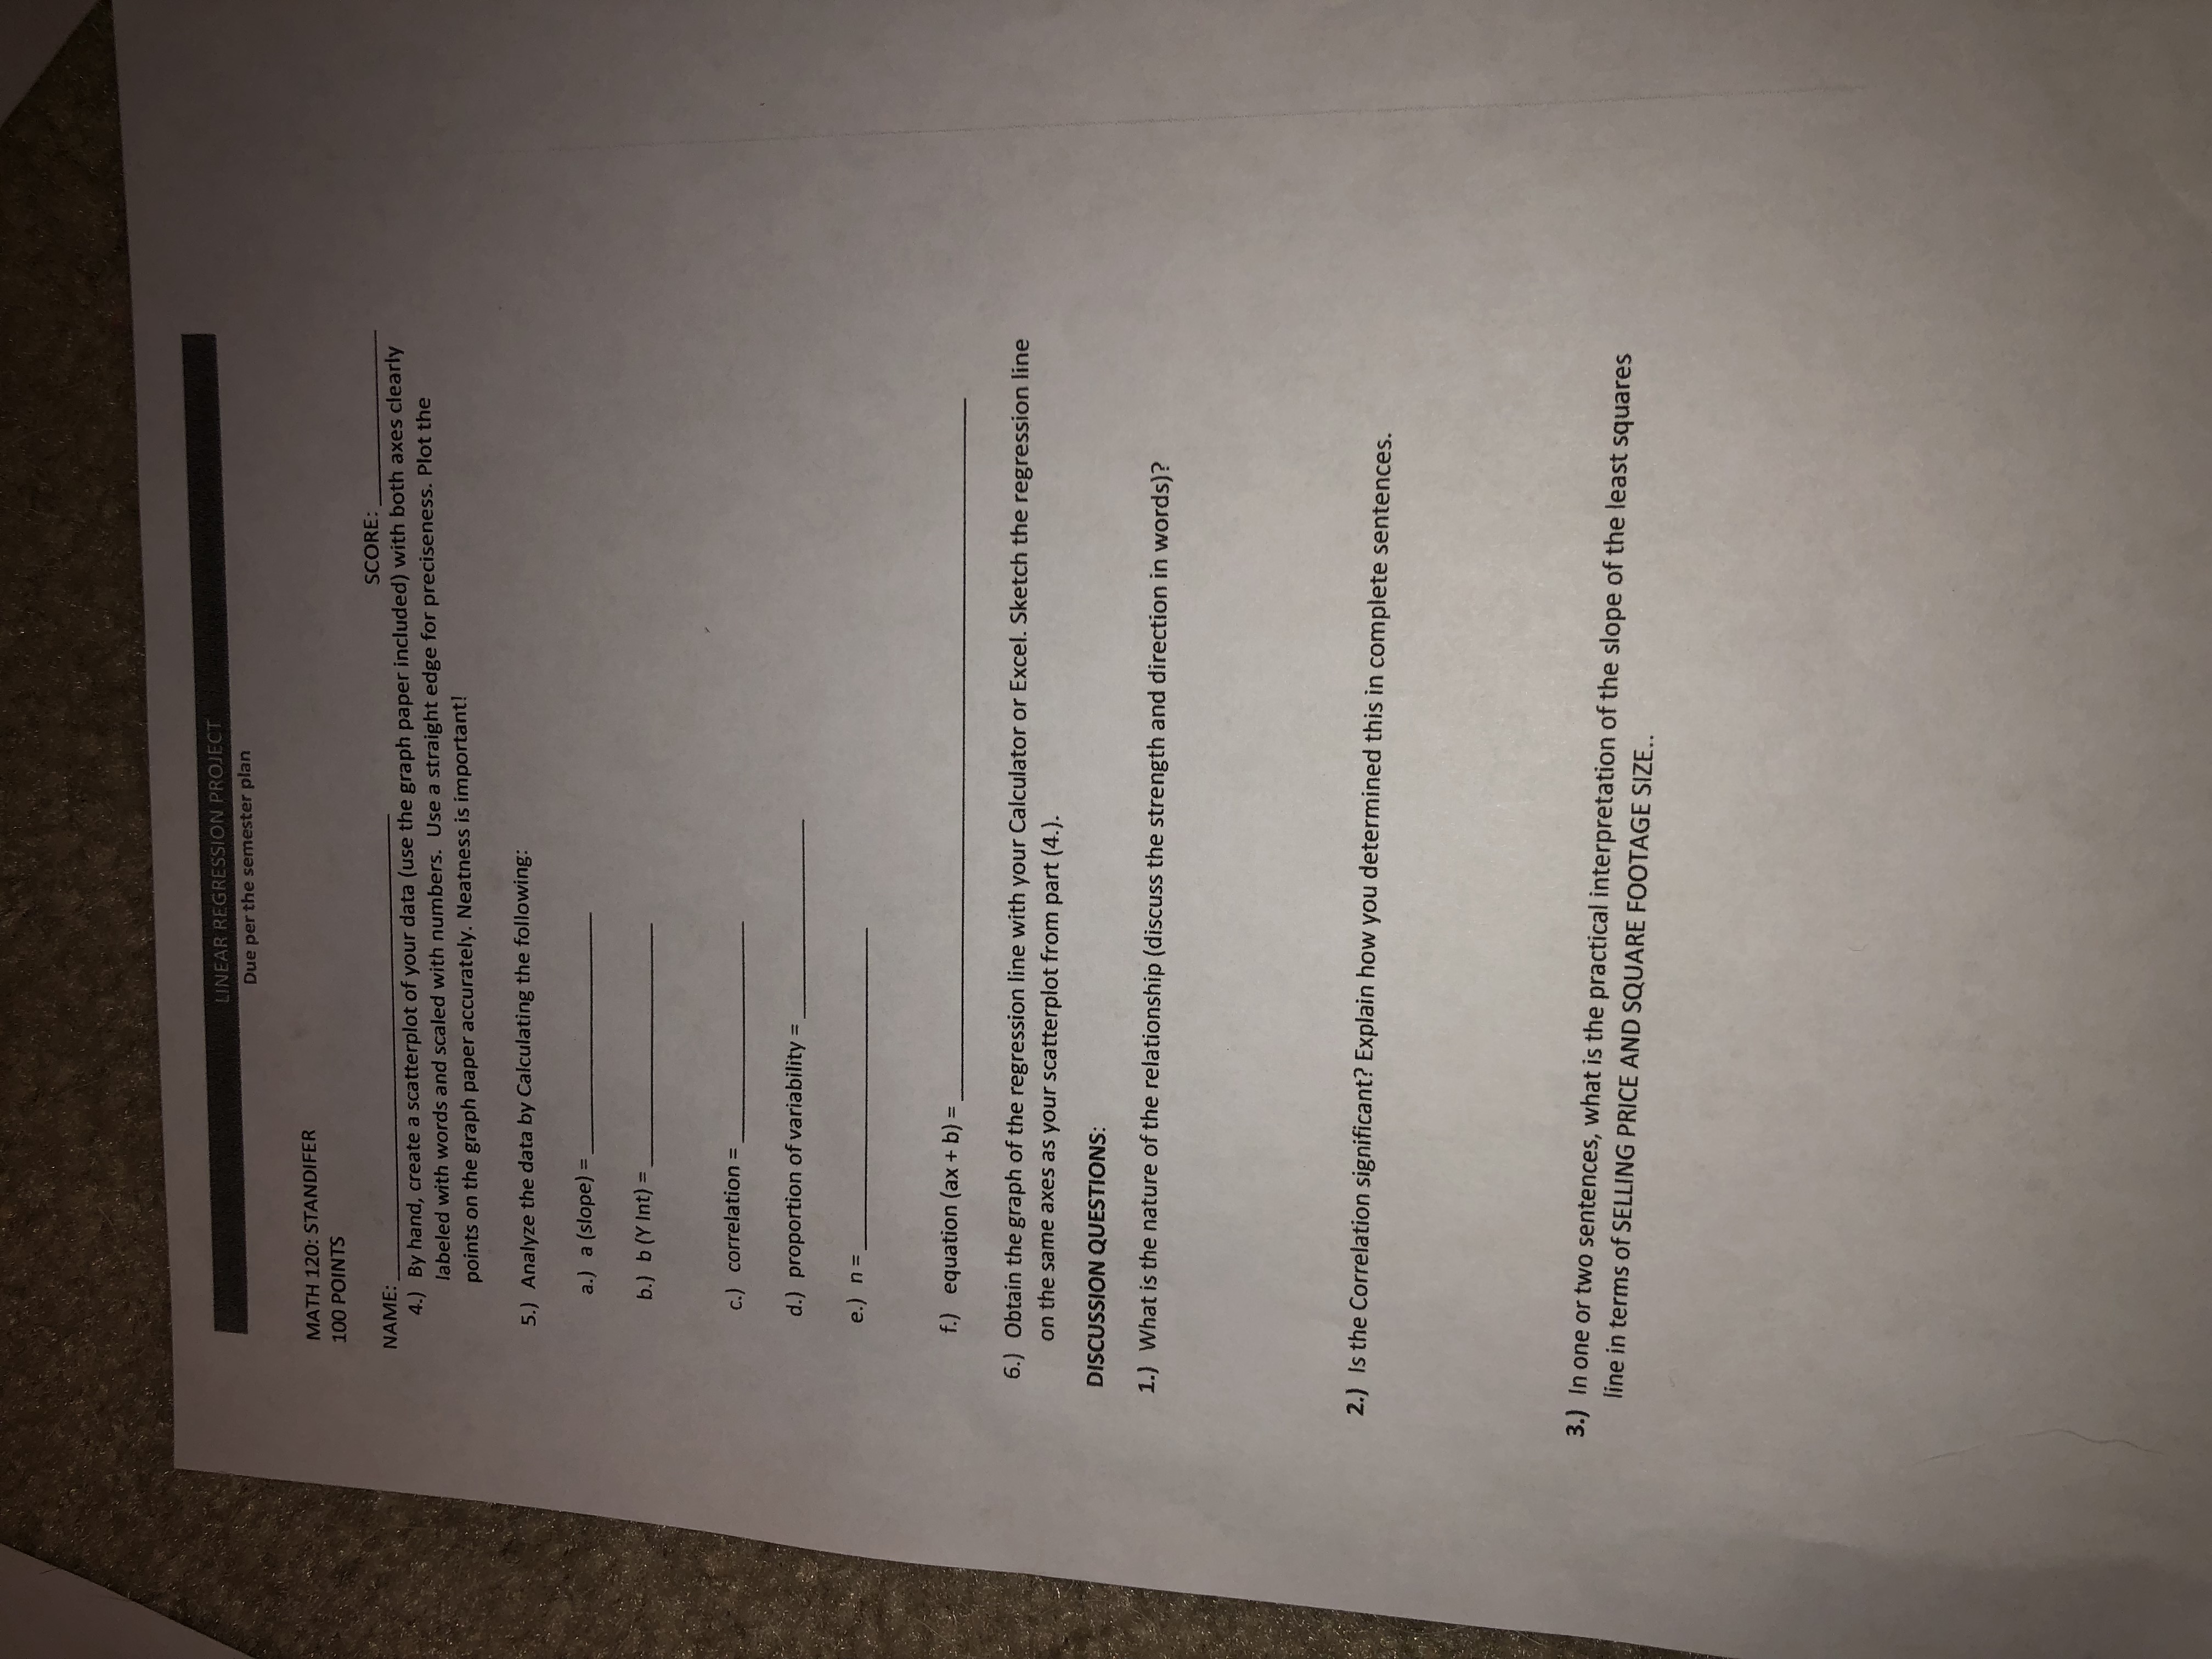
image text in transcribedimage text in transcribedimage text in transcribed
Due per the semester plan MATH 120: STANDIFER 100 POINTS NAME :_ Stefanie Gerhart SCORE: STUDENT LEARNING OUTCOMES: THE STUDENT WILL CALCULATE AND CONSTRUCT THE LINE OF BEST FIT BETWEEN TWO VARIABLES. THE STUDENT WILL EVALUATE THE RELATIONSHIP BETWEEN TWO VARIABLES TO DETERMINE WHAT TYPE OF RELATIONSIP EXITS. THE STUDENT WILL PERFORM AN ANALYSIS OF THE RELATIONSHIP. COLLECT DATA: FIND A REPUTABLE SOURCE FOR LOCAL REAL ESTATE SALES AND RECORD THE SELLING PRICE OF 25 HOMES FOR SALE AND THEIR SQUARE FOOTAGE. 1.) Using your random number generator (TI 83/84), randomly select 14 HOMES FOR SALE from your list and record their SELLING PRICE AND SQUARE FOOTAGE in the table below: SIZE (SQUARE FOOTAGE) SELLING PRICE (THOUSANDS OF DOLLARS) 2 3 20 $ 385,000 40 6 600 0 346 444, 237 2 43 2 $ 465 060 47 9, 90 0 $474,060 16 4140.000 2080 $ 425, 006 1888 13 399, 000 1768 $400,200 738 2, S83 $ 439,000 2.400 1 439. 500 $ 408, 000 2.) Which variable should be the Explanatory variable: Size (Square Footage) 3.) Which variable should be the Response Variable. Selling price (Thousands of Dollars)LINEAR REGRESSION PROJECT Due per the semester plan MATH 120: STANDIFER 100 POINTS NAME : _ SCORE : 4.) By hand, create a scatterplot of your data (use the graph paper included) with both axes clearly labeled with words and scaled with numbers. Use a straight edge for preciseness. Plot the points on the graph paper accurately. Neatness is important! 5.) Analyze the data by Calculating the following: a.) a (slope) = b.) b (Y Int) = c.) correlation = d.) proportion of variability = e. ) n = f.) equation (ax + b) = 6.) Obtain the graph of the regression line with your Calculator or Excel. Sketch the regression line on the same axes as your scatterplot from part (4.). DISCUSSION QUESTIONS: 1.) What is the nature of the relationship (discuss the strength and direction in words)? 2.) Is the Correlation significant? Explain how you determined this in complete sentences. 3.) In one or two sentences, what is the practical interpretation of the slope of the least squares line in terms of SELLING PRICE AND SQUARE FOOTAGE SIZE..Height (ins)- VS-Armspan (ins) y= 65.15*' 639 60 NAME 154 y= axtb 51 Height ( ms ) = 1.018 ( armspam ins ) - 1.021 48 - Grid Paper Height (inches) 36 833 4 (33, 32) possible outlop in 780 ARMSPAN (inches) X = 65"

Step by Step Solution

There are 3 Steps involved in it

Step: 1

blur-text-image

Get Instant Access to Expert-Tailored Solutions

See step-by-step solutions with expert insights and AI powered tools for academic success

Step: 2

blur-text-image

Step: 3

blur-text-image

Ace Your Homework with AI

Get the answers you need in no time with our AI-driven, step-by-step assistance

Get Started

Recommended Textbook for

Algebra And Trigonometry

Authors: Cynthia Y Young

3rd Edition

1118475755, 9781118475751

More Books

Students also viewed these Mathematics questions

Question

How would you improve the Deli Depot survey and questionnaire?

Answered: 1 week ago

Question

Design a job advertisement.

Answered: 1 week ago