Link to data required attached below https://drive.google.com/drive/folders/1LTx-MVOBQgFrLwrl1fe5EtZK4GfaenB7?usp=sharing Homework 10: Multiple Linear Regression NAME: Your Name NETID: Your NetID DUE DATE: November 29, 2021 by 11:59pm
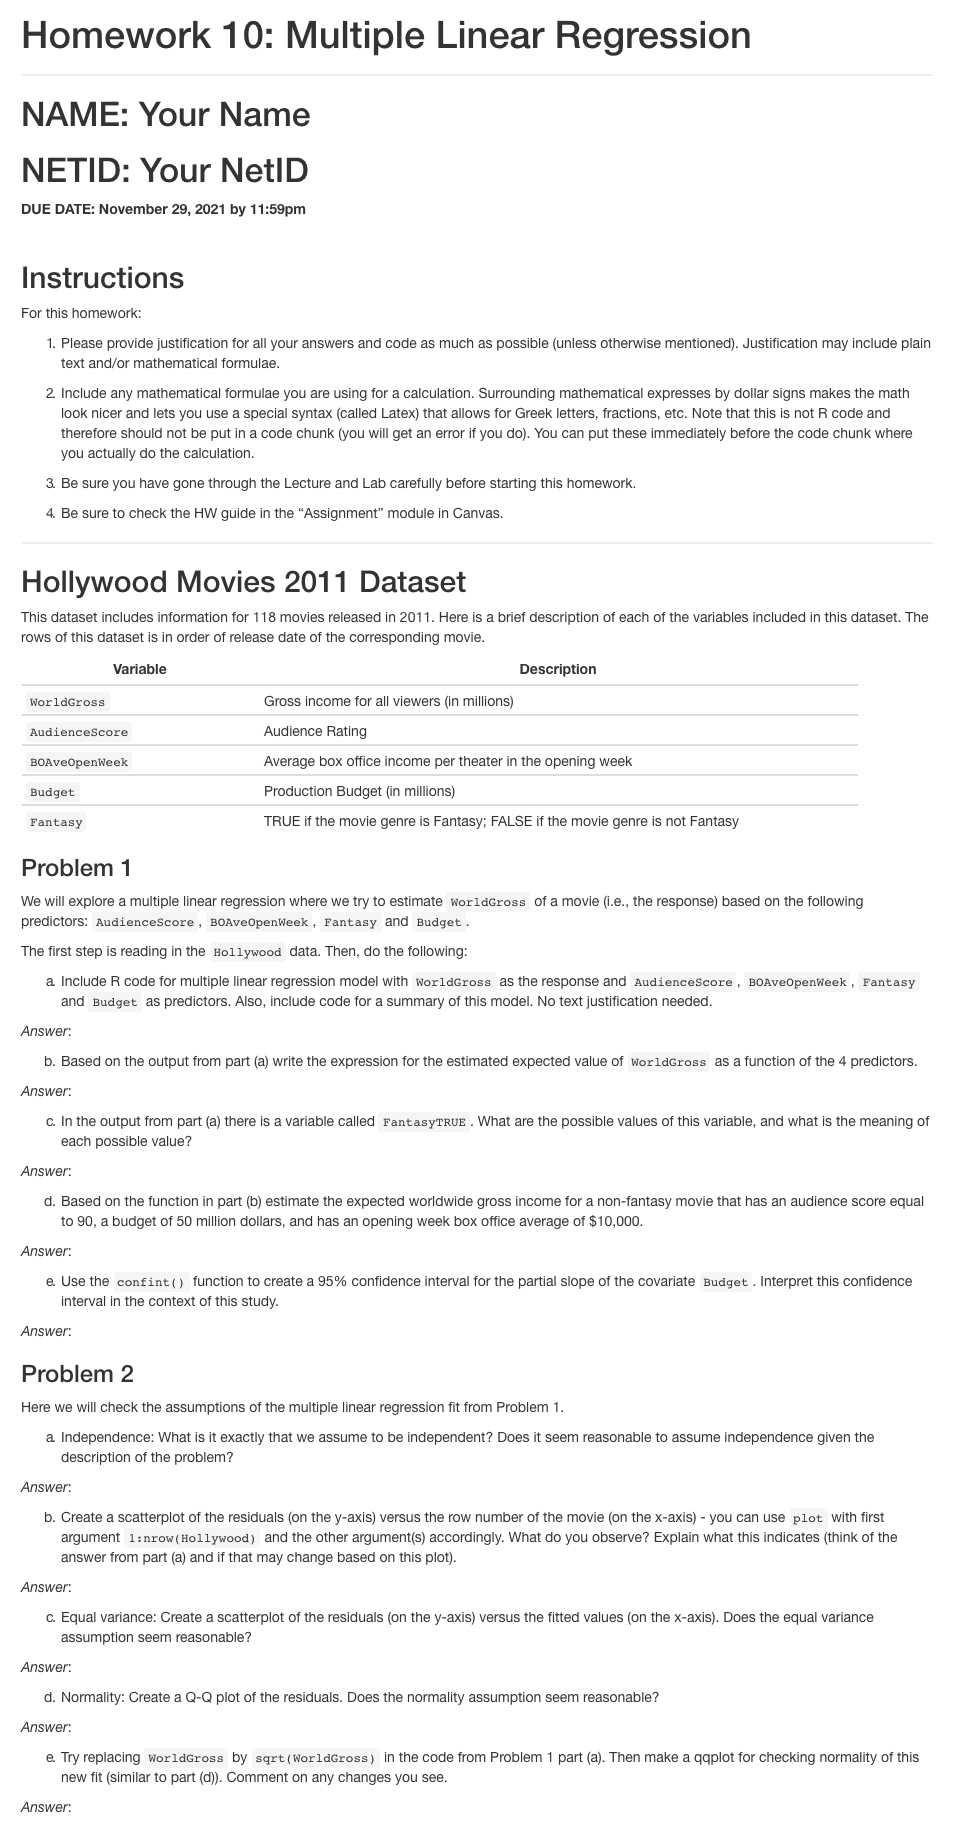
Homework 10: Multiple Linear Regression NAME: Your Name NETID: Your NetID DUE DATE: November 29, 2021 by 11:59pm Instructions For this homework: 1. Please provide justification for all your answers and code as much as possible (unless otherwise mentioned). Justification may include plain text and/or mathematical formulae. 2. Include any mathematical formulae you are using for a calculation. Surrounding mathematical expresses by dollar signs makes the math look nicer and lets you use a special syntax (called Latex) that allows for Greek letters, fractions, etc. Note that this is not R code and therefore should not be put in a code chunk (you will get an error if you do). You can put these immediately before the code chunk where you actually do the calculation. 3. Be sure you have gone through the Lecture and Lab carefully before starting this homework. 4. Be sure to check the HW guide in the "Assignment" module in Canvas. Hollywood Movies 2011 Dataset This dataset includes information for 118 movies released in 2011. Here is a brief description of each of the variables included in this dataset. The rows of this dataset is in order of release date of the corresponding movie. Variable Description WorldGross Gross income for all viewers (in millions) AudienceScore Audience Rating BOAveOpenWeek Average box office income per theater in the opening week Budget Production Budget (in millions) Fantasy TRUE if the movie genre is Fantasy; FALSE if the movie genre is not Fantasy Problem 1 We will explore a multiple linear regression where we try to estimate worldGross of a movie (i.e., the response) based on the following predictors: AudienceScore , BOAveOpenWeek , Fantasy and Budget . The first step is reading in the Hollywood data. Then, do the following: a Include R code for multiple linear regression model with worldGross as the response and AudienceScore , BOAveOpenWeek , Fantasy and Budget as predictors. Also, include code for a summary of this model. No text justification needed. Answer: b. Based on the output from part (a) write the expression for the estimated expected value of WorldGross as a function of the 4 predictors. Answer: C. In the output from part (a) there is a variable called FantasyTRUE . What are the possible values of this variable, and what is the meaning of each possible value? Answer: d. Based on the function in part (b) estimate the expected worldwide gross income for a non-fantasy movie that has an audience score equal to 90, a budget of 50 million dollars, and has an opening week box office average of $10,000. Answer: e. Use the confint ( ) function to create a 95% confidence interval for the partial slope of the covariate Budget . Interpret this confidence interval in the context of this study. Answer: Problem 2 Here we will check the assumptions of the multiple linear regression fit from Problem 1. a Independence: What is it exactly that we assume to be independent? Does it seem reasonable to assume independence given the description of the problem? Answer: b. Create a scatterplot of the residuals (on the y-axis) versus the row number of the movie (on the x-axis) - you can use plot with first argument 1:nrow(Hollywood) and the other argument(s) accordingly. What do you observe? Explain what this indicates (think of the answer from part (a) and if that may change based on this plot). Answer: C. Equal variance: Create a scatterplot of the residuals (on the y-axis) versus the fitted values (on the x-axis). Does the equal variance assumption seem reasonable? Answer: d. Normality: Create a Q-Q plot of the residuals. Does the normality assumption seem reasonable? Answer: e. Try replacing WorldGross by sqrt (WorldGross) in the code from Problem 1 part (a). Then make a qqplot for checking normality of this new fit (similar to part (d)). Comment on any changes you see
Step by Step Solution
There are 3 Steps involved in it
Step: 1
Get Instant Access to Expert-Tailored Solutions
See step-by-step solutions with expert insights and AI powered tools for academic success
Step: 2
Step: 3
Ace Your Homework with AI
Get the answers you need in no time with our AI-driven, step-by-step assistance