

Answered step by step
Verified Expert Solution
Question
1 Approved Answer
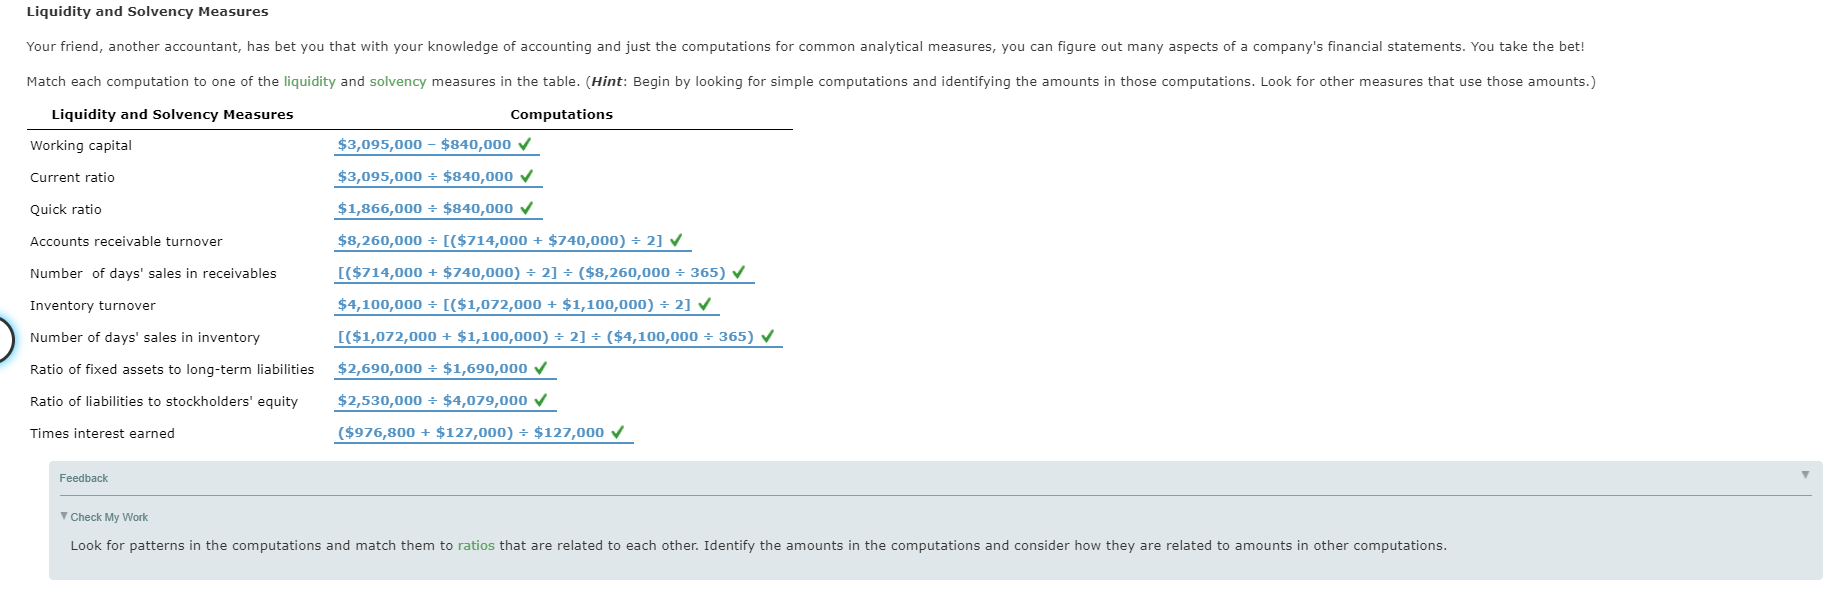
Liquidity and Solvency Measures Your friend, another accountant, has bet you that with your knowledge of accounting and just the computations for common analytical measures,
Step by Step Solution
There are 3 Steps involved in it
Step: 1

Get Instant Access with AI-Powered Solutions
See step-by-step solutions with expert insights and AI powered tools for academic success
Step: 2

Step: 3
Ace Your Homework with AI
Get the answers you need in no time with our AI-driven, step-by-step assistance
Get Started
Financial Accounting an introduction to concepts, methods and uses
Authors: Clyde P. Stickney, Roman L. Weil, Katherine Schipper, Jennifer Francis
13th Edition
978-0538776080, 324651147, 538776080, 9780324651140, 978-0324789003