

Answered step by step
Verified Expert Solution
Question
1 Approved Answer
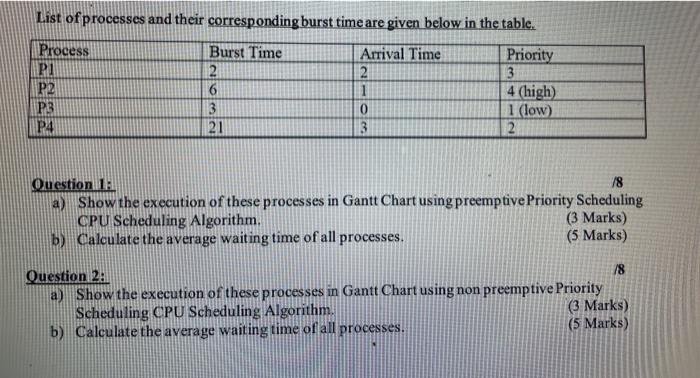
List of processes and their corresponding burst time are given below in the table. Process P1 P2 P3 P4 Burst Time 2 6 3 21
Step by Step Solution
There are 3 Steps involved in it
Step: 1

Get Instant Access to Expert-Tailored Solutions
See step-by-step solutions with expert insights and AI powered tools for academic success
Step: 2

Step: 3
Ace Your Homework with AI
Get the answers you need in no time with our AI-driven, step-by-step assistance
Get Started
Linked Data A Geographic Perspective
Authors: Glen Hart, Catherine Dolbear
1st Edition
1000218910, 9781000218916