Answered step by step
Verified Expert Solution
Question
1 Approved Answer
Listed below are time intervals (min) between eruptions of a geyser. Assume that the recent times are within the past few years, the past times
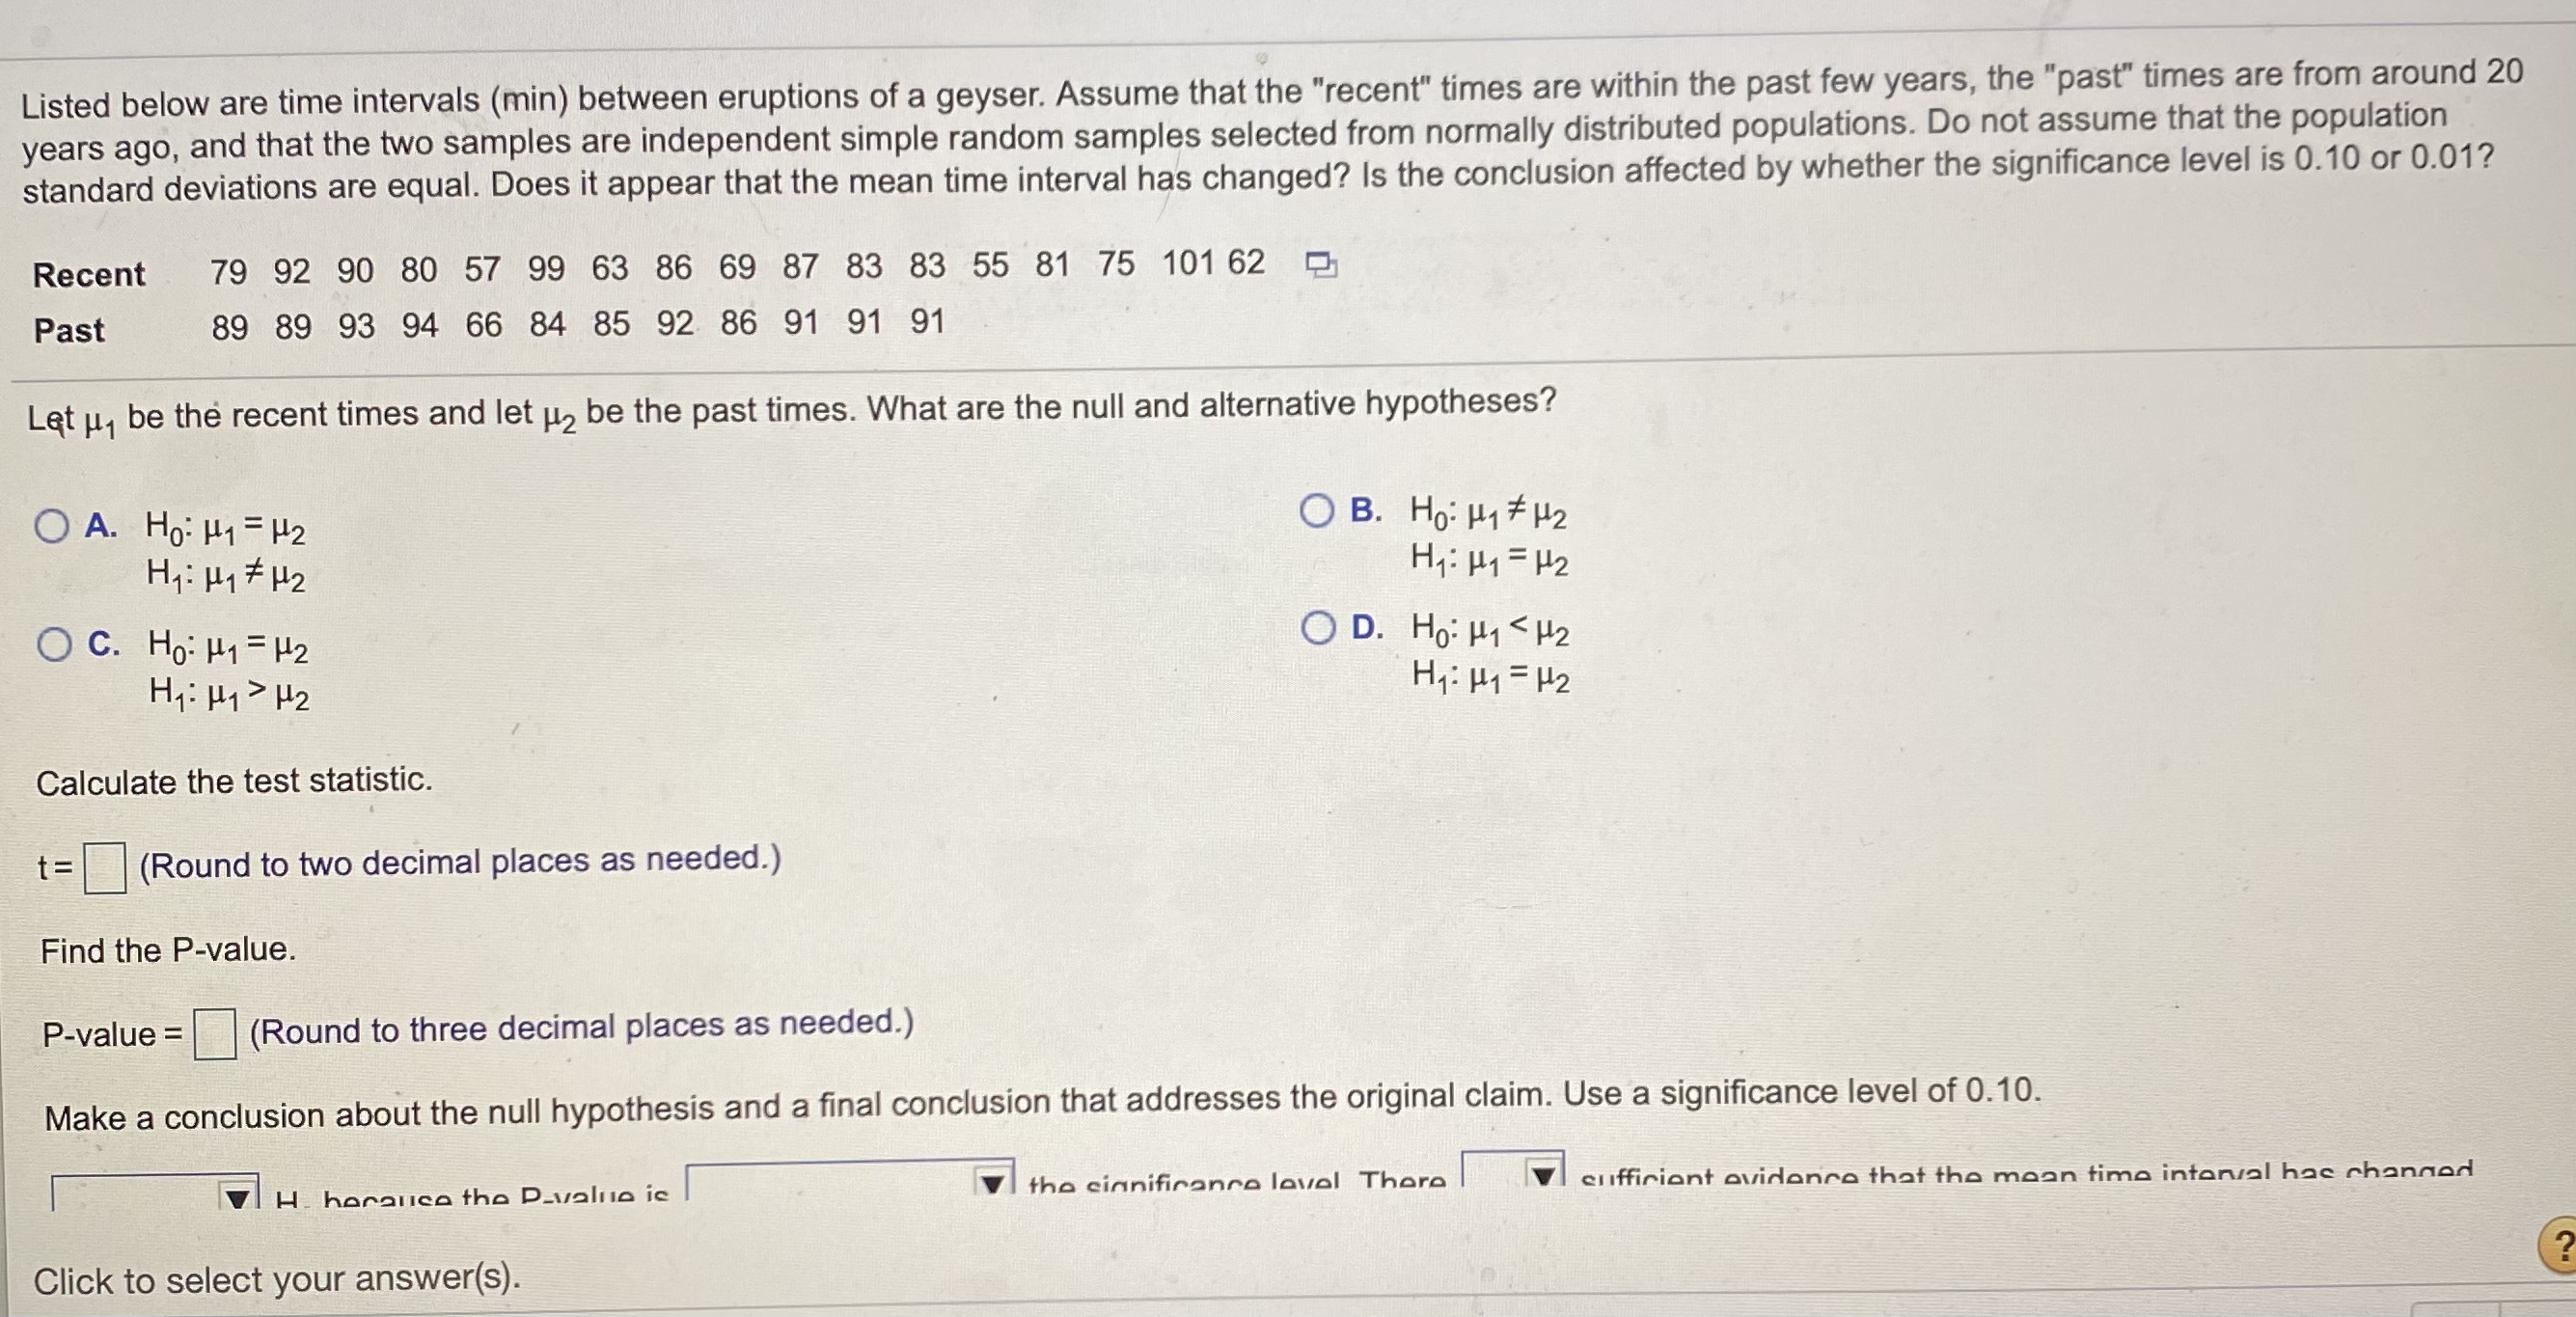
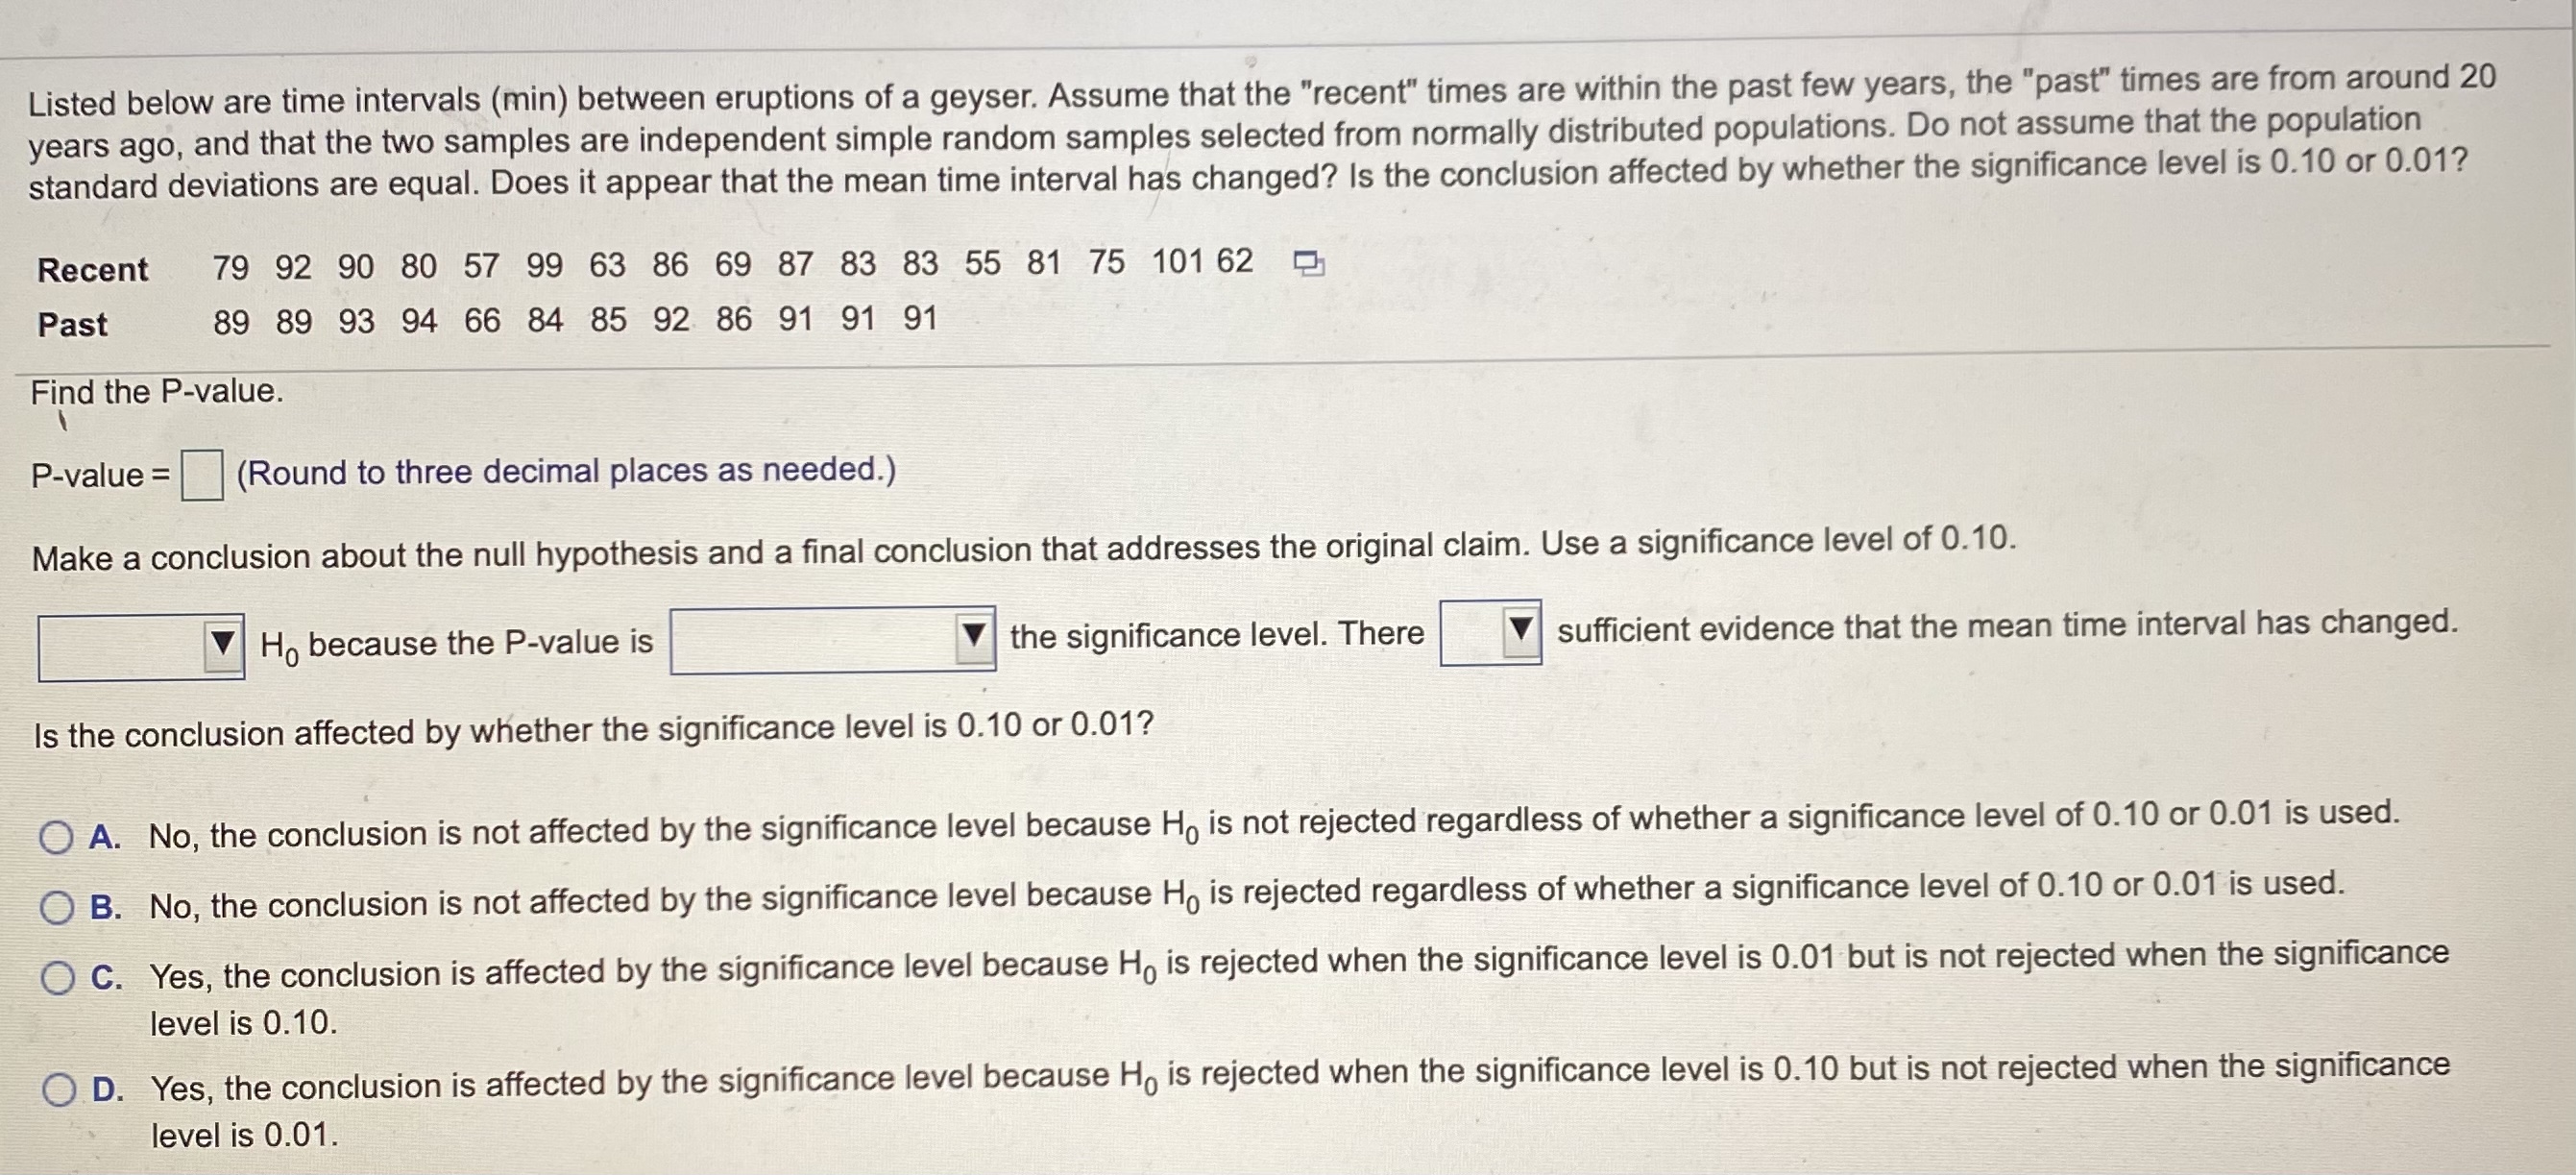
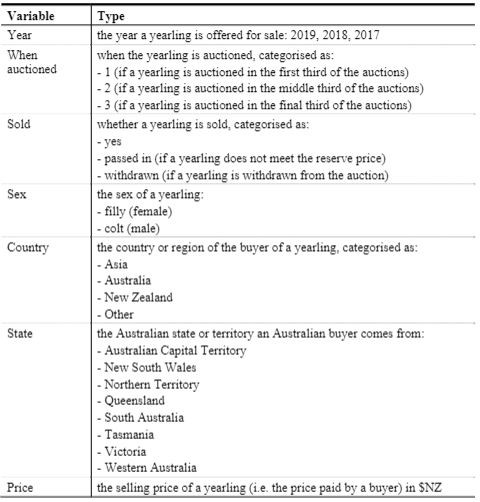
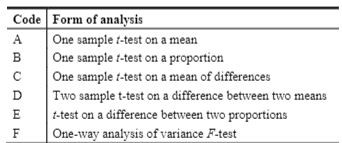
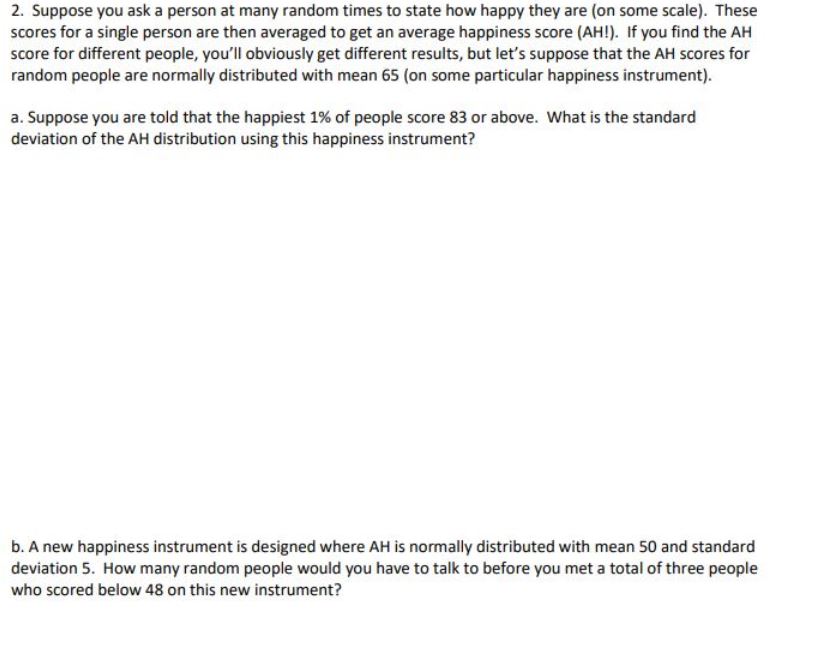
H2 Hy: My = H2 Calculate the test statistic. t= (Round to two decimal places as needed.) Find the P-value. P-value = (Round to three decimal places as needed.) Make a conclusion about the null hypothesis and a final conclusion that addresses the original claim. Use a significance level of 0. 10. 7 H. horanco the D_valnie ic the cinnifinance laval There VI cliffiriont evidence that the moan time interval has channod Click to select your answer(s).Listed below are time intervals (min) between eruptions of a geyser. Assume that the "recent" times are within the past few years, the "past" times are from around 20 years ago, and that the two samples are independent simple random samples selected from normally distributed populations. Do not assume that the population standard deviations are equal. Does it appear that the mean time interval has changed? Is the conclusion affected by whether the significance level is 0.10 or 0.01? Recent 79 92 90 80 57 99 63 86 69 87 83 83 55 81 75 101 62 Past 89 89 93 94 66 84 85 92 86 91 91 91 Find the P-value. P-value = (Round to three decimal places as needed.) Make a conclusion about the null hypothesis and a final conclusion that addresses the original claim. Use a significance level of 0.10. Ho because the P-value is the significance level. There sufficient evidence that the mean time interval has changed. Is the conclusion affected by whether the significance level is 0.10 or 0.01? O A. No, the conclusion is not affected by the significance level because Ho is not rejected regardless of whether a significance level of 0.10 or 0.01 is used. O B. No, the conclusion is not affected by the significance level because Ho is rejected regardless of whether a significance level of 0.10 or 0.01 is used. O C. Yes, the conclusion is affected by the significance level because Ho is rejected when the significance level is 0.01 but is not rejected when the significance level is 0.10. O. D. Yes, the conclusion is affected by the significance level because Ho is rejected when the significance level is 0.10 but is not rejected when the significance level is 0.01.\fVariable Type Year the year a yearling is offered for sale: 2019, 2018, 2017 When when the yearling is auctioned, categorised as: auctioned - 1 (if a yearling is auctioned in the first third of the auctions) - 2 (if a yearling is auctioned in the middle third of the auctions) - 3 (if a yearling is auctioned in the final third of the auctions) Sold whether a yearling is sold, categorised as: - yes - passed in (if a yearling does not meet the reserve price) - withdrawn (if a yearling is withdrawn from the auction) Sex the sex of a yearling: - filly (female) - colt (male) Country the country or region of the buyer of a yearling, categorised as: - Asia - Australia - New Zealand . Other State the Australian state or territory an Australian buyer comes from: - Australian Capital Territory - New South Wales - Northern Territory Queensland South Australia - Tasmania - Victoria - Western Australia Price the selling price of a yearling (i.e. the price paid by a buyer) in $NZCode Form of analysis One sample f-test on a mean One sample f-test on a proportion One sample f-test on a mean of differences Two sample t-test on a difference between two means f-test on a difference between two proportions One-way analysis of variance F-test2. Suppose you ask a person at many random times to state how happy they are [on some scale}. These scores fora singie person are then averaged to get an average happiness snore [AHIL If you nd the AH score for different people. you'll curiously get different results, but let's suppose that the AH scores for random people are normaily distributed with mean 65 [on some particular happiness instrument}. a. Suppose you are told that the happiest 1% of people score 83 or above. What is the standard deviation of the AH distribution using this happiness instrument? b. A new happiness instrument is designed where AH is normallyI distributed with mean 50 and standard deviation 5. How marryr random peopie would you have to talk to before you met a total ofthree people who scored below 43 on this new instrument
Step by Step Solution
There are 3 Steps involved in it
Step: 1

Get Instant Access to Expert-Tailored Solutions
See step-by-step solutions with expert insights and AI powered tools for academic success
Step: 2

Step: 3

Ace Your Homework with AI
Get the answers you need in no time with our AI-driven, step-by-step assistance
Get Started


