

Answered step by step
Verified Expert Solution
Question
1 Approved Answer
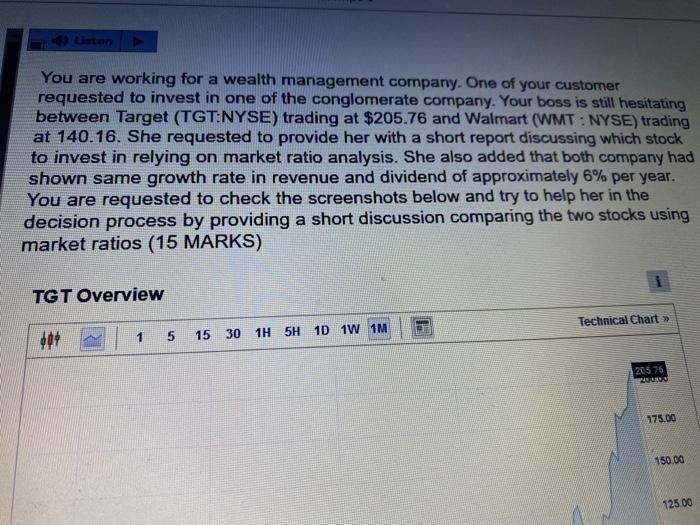
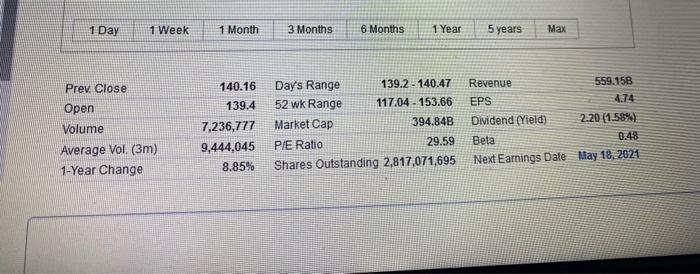
Liten You are working for a wealth management company. One of your customer requested to invest in one of the conglomerate company. Your boss is


Step by Step Solution
There are 3 Steps involved in it
Step: 1

Get Instant Access to Expert-Tailored Solutions
See step-by-step solutions with expert insights and AI powered tools for academic success
Step: 2

Step: 3
Ace Your Homework with AI
Get the answers you need in no time with our AI-driven, step-by-step assistance
Get Started
The Ascendancy Of Finance
Authors: Joseph Vogl, Simon Garnett
1st Edition
1509509305, 978-1509509300