Answered step by step
Verified Expert Solution
Question
1 Approved Answer
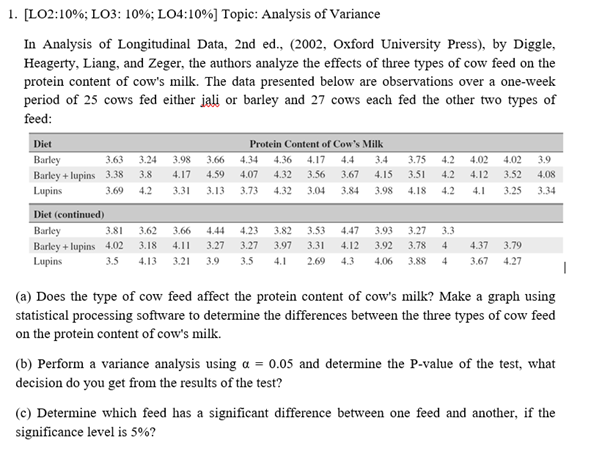
[ LO 2 : 1 0 % ; LO 3 : 1 0 % ; L O 4 : 1 0 % Topic: Analysis of
LO:; LO: ;: Topic: Analysis of Variance
In Analysis of Longitudinal Data, nd ed Oxford University Press by Diggle,
Heagerty, Liang, and Zeger, the authors analyze the effects of three types of cow feed on the
protein content of cow's milk. The data presented below are observations over a oneweek
period of cows fed either jali or barley and cows each fed the other two types of
feed:
a Does the type of cow feed affect the protein content of cow's milk? Make a graph using
statistical processing software to determine the differences between the three types of cow feed
on the protein content of cow's milk.
b Perform a variance analysis using and determine the P value of the test, what
decision do you get from the results of the test?
c Determine which feed has a significant difference between one feed and another, if the
significance level is LO:; LO: Topic: Factorial Design of Experiments
a Explain what is meant by Design of Experiments and k Factorial Design?
b Explain the assumptions, data type requirements and data analysis formulas for
designing an experiment!
c Mention how many types of factorial designs for this data and if a researcher wants to
analyze the data, explain the steps or basic formulas related to the concept of the data
analysis stages!
i An engineer is interested in seeing the effects of cutting speed A metal
hardness B and cutting angle C on the service life of the cutting tool.
ii The R&D Team of a Semiconductor Manufacturing Company wants to know the
results of the following factors with each at two levels, namely Factors and levels
are aperture setting small large; exposure time below nominal,
above nominal; development time and seconds; mask
dimensions small large; and etch time and minutesLO:; LO: Topic: Statistical Quality Control
In an automotive engine manufacturing company, samples of engines were observed to calculate the number of defect points. The following is the data for the samples.
tableSampletableNo ofDefectivesSample,tableNo ofDefectives
a Create a Pchart for this process. Is the process still within the lower and upper limits controlled by statistical control?
b Suppose the sample is only pcs Use the table data to create a Pchart diagram for this process. Revise the lower and upper limits of statistical control limits if necessary
c Compare the control limits in parts a and b Explain why they are different? Topic: Statistical Quality Control
A shipbuilding industry is taking specification data for the outer diameter of the hub, which is A random sample of size is taken and the data is shown in the following table:
tableSamplexSample,x
a Construct a control chart for the individual measurements of the sample. Calculate the control limits Explain what conclusions you draw from these measurements.
b Compare your chart in part a with a chart that uses only the last least significant digit of each diameter as the measurement. Explain your conclusions.
c Estimate and from the revised range of motion and use these values to estimate PCR and PCRk
d Explain the interpretation of these ratios. mana saja yang menunjukkan perbedaan?

Step by Step Solution
There are 3 Steps involved in it
Step: 1

Get Instant Access to Expert-Tailored Solutions
See step-by-step solutions with expert insights and AI powered tools for academic success
Step: 2

Step: 3

Ace Your Homework with AI
Get the answers you need in no time with our AI-driven, step-by-step assistance
Get Started


