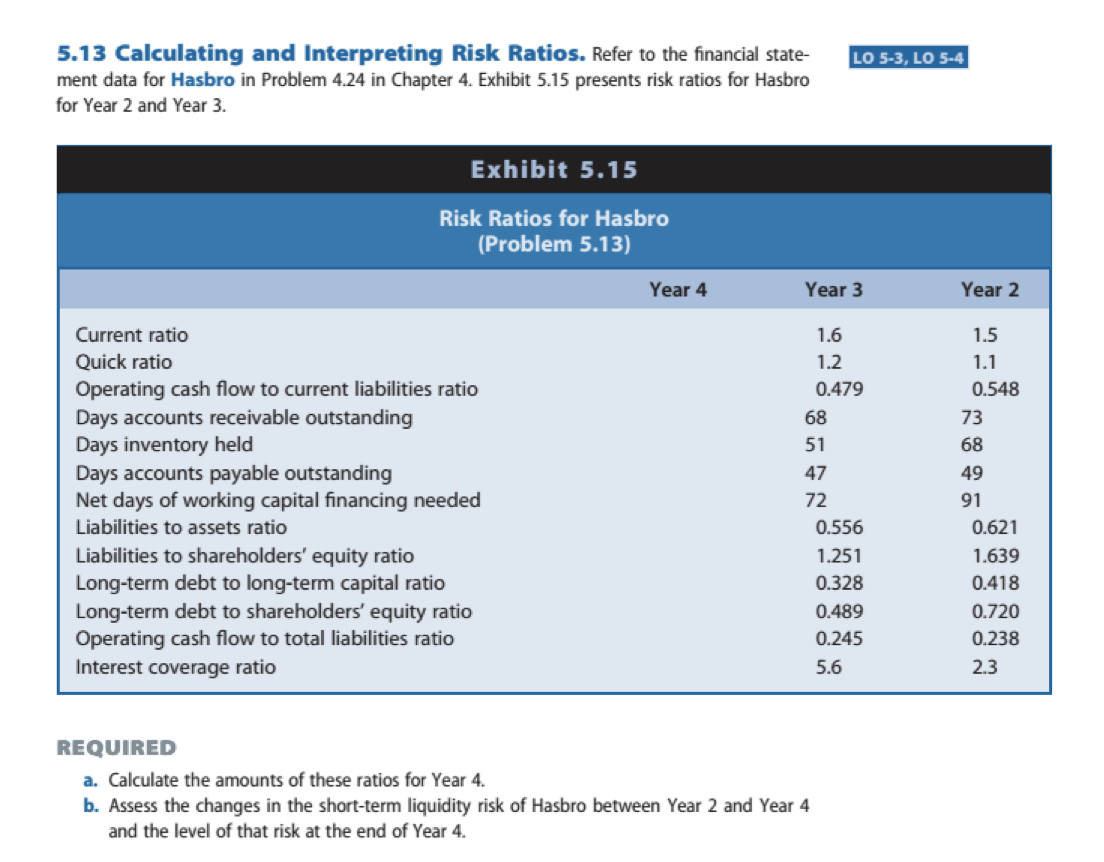
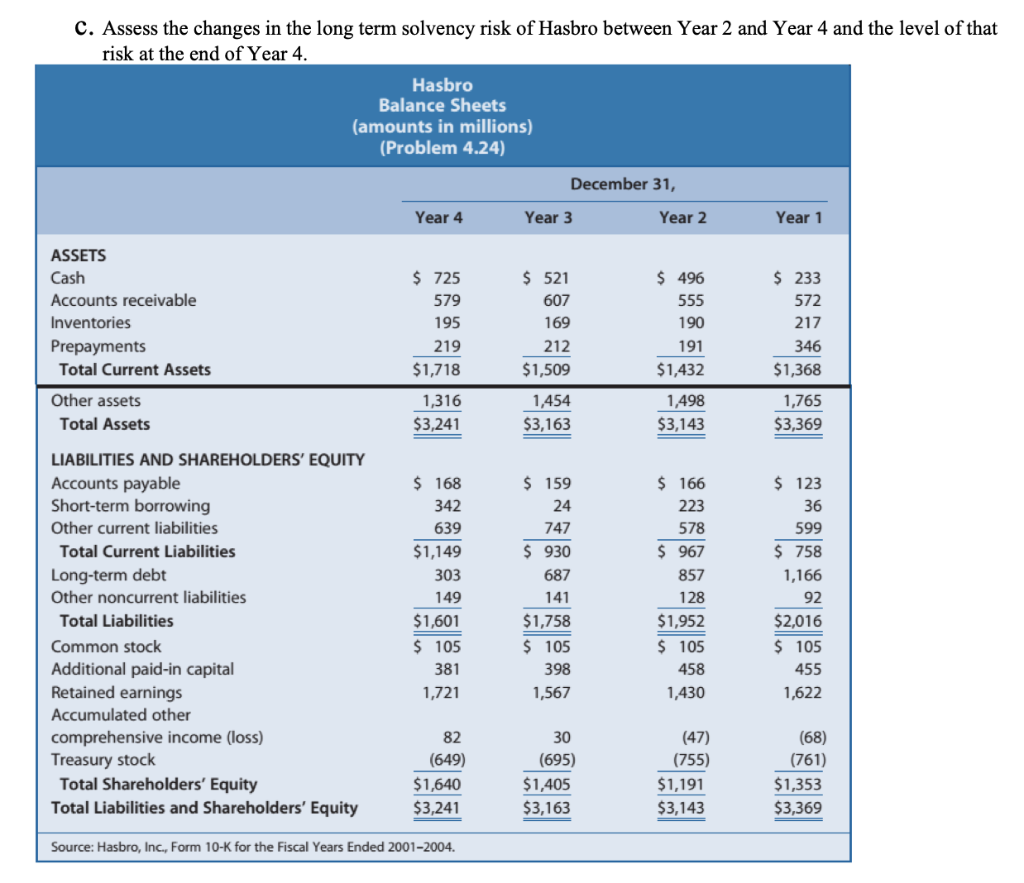
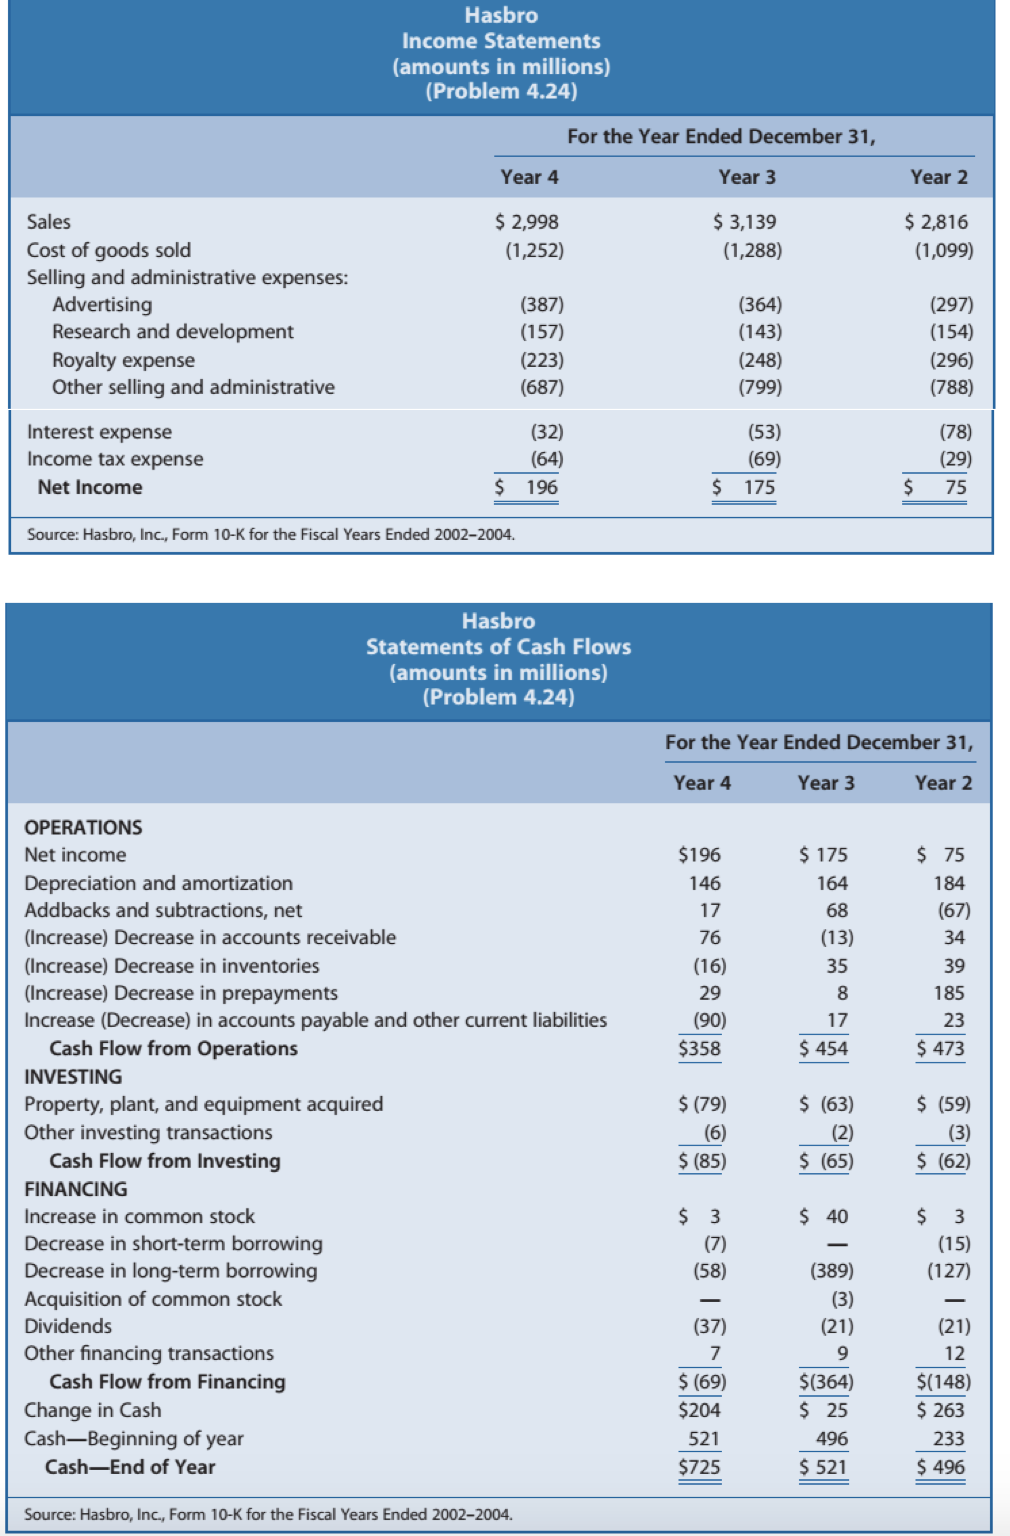
LO 5-3, LO 5-4 5.13 Calculating and Interpreting Risk Ratios. Refer to the financial state- ment data for Hasbro in Problem 4.24 in Chapter 4. Exhibit 5.15 presents risk ratios for Hasbro for Year 2 and Year 3. Exhibit 5.15 Risk Ratios for Hasbro (Problem 5.13) Year 4 Year 3 Year 2 Current ratio Quick ratio Operating cash flow to current liabilities ratio Days accounts receivable outstanding Days inventory held Days accounts payable outstanding Net days of working capital financing needed Liabilities to assets ratio Liabilities to shareholders' equity ratio Long-term debt to long-term capital ratio Long-term debt to shareholders' equity ratio Operating cash flow to total liabilities ratio Interest coverage ratio 1.6 1.2 0.479 68 51 47 72 0.556 1.251 0.328 0.489 0.245 5.6 1.5 1.1 0.548 73 68 49 91 0.621 1.639 0.418 0.720 0.238 2.3 REQUIRED a. Calculate the amounts of these ratios for Year 4. b. Assess the changes in the short-term liquidity risk of Hasbro between Year 2 and Year 4 and the level of that risk at the end of Year 4. c. Assess the changes in the long term solvency risk of Hasbro between Year 2 and Year 4 and the level of that risk at the end of Year 4. Hasbro Balance Sheets (amounts in millions) (Problem 4.24) December 31, Year 4 Year 3 Year 2 Year 1 ASSETS Cash Accounts receivable Inventories Prepayments Total Current Assets $ 725 579 195 219 $1,718 $ 521 607 169 212 $1,509 $ 496 555 190 191 $ 233 572 217 346 $1,368 $1,432 Other assets Total Assets 1,316 $3,241 1,454 $3,163 1,498 $3,143 1,765 $3,369 $ 168 342 639 $1,149 303 149 LIABILITIES AND SHAREHOLDERS' EQUITY Accounts payable Short-term borrowing Other current liabilities Total Current Liabilities Long-term debt Other noncurrent liabilities Total Liabilities Common stock Additional paid-in capital Retained earnings Accumulated other comprehensive income (loss) Treasury stock Total Shareholders' Equity Total Liabilities and Shareholders' Equity $ 159 24 747 $ 930 687 141 $1,758 $ 105 398 1,567 $ 166 223 578 $ 967 857 128 $1,952 $ 105 458 1,430 $123 36 599 $ 758 1,166 92 $2,016 $ 105 455 1,622 $1,601 $ 105 381 1,721 82 (649) $1,640 $3,241 30 (695) $1,405 $3,163 (47) (755) $1,191 $3,143 (68) (761) $1,353 $3,369 Source: Hasbro, Inc., Form 10-K for the Fiscal Years Ended 2001-2004. Hasbro Income Statements (amounts in millions) (Problem 4.24) For the Year Ended December 31, Year 4 Year 3 Year 2 $ 2,998 (1,252) $ 3,139 (1,288) $ 2,816 (1,099) Sales Cost of goods sold Selling and administrative expenses: Advertising Research and development Royalty expense Other selling and administrative (387) (157) (223) (687) (364) (143) (248) (799) (297) (154) (296) (788) Interest expense Income tax expense Net Income (32) (64) $ 196 (53) (69) $ 175 (78) (29) 75 $ Source: Hasbro, Inc., Form 10-K for the Fiscal Years Ended 2002-2004. Hasbro Statements of Cash Flows (amounts in millions) (Problem 4.24) For the Year Ended December 31, Year 4 Year 3 Year 2 $196 146 17 76 (16) 29 (90) $358 $ 175 164 68 (13) 35 8 17 $ 454 $ 75 184 (67) 34 39 185 23 $ 473 OPERATIONS Net income Depreciation and amortization Addbacks and subtractions, net (Increase) Decrease in accounts receivable (Increase) Decrease in inventories (Increase) Decrease in prepayments Increase (Decrease) in accounts payable and other current liabilities Cash Flow from Operations INVESTING Property, plant, and equipment acquired Other investing transactions Cash Flow from Investing FINANCING Increase in common stock Decrease in short-term borrowing Decrease in long-term borrowing Acquisition of common stock Dividends Other financing transactions Cash Flow from Financing Change in Cash CashBeginning of year Cash-End of Year $ (79) (6) $(85) $ (63) (2) $ (65) $ (59) (3) $ (62) $ 40 $ 3 (7) (58) $ 3 (15) (127) (37) 7 $ (69) $204 521 $725 (389) (3) (21) 9 $(364) $ 25 496 $ 521 (21) 12 $(148) $ 263 233 $ 496 Source: Hasbro, Inc., Form 10-K for the Fiscal Years Ended 2002-2004. LO 5-3, LO 5-4 5.13 Calculating and Interpreting Risk Ratios. Refer to the financial state- ment data for Hasbro in Problem 4.24 in Chapter 4. Exhibit 5.15 presents risk ratios for Hasbro for Year 2 and Year 3. Exhibit 5.15 Risk Ratios for Hasbro (Problem 5.13) Year 4 Year 3 Year 2 Current ratio Quick ratio Operating cash flow to current liabilities ratio Days accounts receivable outstanding Days inventory held Days accounts payable outstanding Net days of working capital financing needed Liabilities to assets ratio Liabilities to shareholders' equity ratio Long-term debt to long-term capital ratio Long-term debt to shareholders' equity ratio Operating cash flow to total liabilities ratio Interest coverage ratio 1.6 1.2 0.479 68 51 47 72 0.556 1.251 0.328 0.489 0.245 5.6 1.5 1.1 0.548 73 68 49 91 0.621 1.639 0.418 0.720 0.238 2.3 REQUIRED a. Calculate the amounts of these ratios for Year 4. b. Assess the changes in the short-term liquidity risk of Hasbro between Year 2 and Year 4 and the level of that risk at the end of Year 4. c. Assess the changes in the long term solvency risk of Hasbro between Year 2 and Year 4 and the level of that risk at the end of Year 4. Hasbro Balance Sheets (amounts in millions) (Problem 4.24) December 31, Year 4 Year 3 Year 2 Year 1 ASSETS Cash Accounts receivable Inventories Prepayments Total Current Assets $ 725 579 195 219 $1,718 $ 521 607 169 212 $1,509 $ 496 555 190 191 $ 233 572 217 346 $1,368 $1,432 Other assets Total Assets 1,316 $3,241 1,454 $3,163 1,498 $3,143 1,765 $3,369 $ 168 342 639 $1,149 303 149 LIABILITIES AND SHAREHOLDERS' EQUITY Accounts payable Short-term borrowing Other current liabilities Total Current Liabilities Long-term debt Other noncurrent liabilities Total Liabilities Common stock Additional paid-in capital Retained earnings Accumulated other comprehensive income (loss) Treasury stock Total Shareholders' Equity Total Liabilities and Shareholders' Equity $ 159 24 747 $ 930 687 141 $1,758 $ 105 398 1,567 $ 166 223 578 $ 967 857 128 $1,952 $ 105 458 1,430 $123 36 599 $ 758 1,166 92 $2,016 $ 105 455 1,622 $1,601 $ 105 381 1,721 82 (649) $1,640 $3,241 30 (695) $1,405 $3,163 (47) (755) $1,191 $3,143 (68) (761) $1,353 $3,369 Source: Hasbro, Inc., Form 10-K for the Fiscal Years Ended 2001-2004. Hasbro Income Statements (amounts in millions) (Problem 4.24) For the Year Ended December 31, Year 4 Year 3 Year 2 $ 2,998 (1,252) $ 3,139 (1,288) $ 2,816 (1,099) Sales Cost of goods sold Selling and administrative expenses: Advertising Research and development Royalty expense Other selling and administrative (387) (157) (223) (687) (364) (143) (248) (799) (297) (154) (296) (788) Interest expense Income tax expense Net Income (32) (64) $ 196 (53) (69) $ 175 (78) (29) 75 $ Source: Hasbro, Inc., Form 10-K for the Fiscal Years Ended 2002-2004. Hasbro Statements of Cash Flows (amounts in millions) (Problem 4.24) For the Year Ended December 31, Year 4 Year 3 Year 2 $196 146 17 76 (16) 29 (90) $358 $ 175 164 68 (13) 35 8 17 $ 454 $ 75 184 (67) 34 39 185 23 $ 473 OPERATIONS Net income Depreciation and amortization Addbacks and subtractions, net (Increase) Decrease in accounts receivable (Increase) Decrease in inventories (Increase) Decrease in prepayments Increase (Decrease) in accounts payable and other current liabilities Cash Flow from Operations INVESTING Property, plant, and equipment acquired Other investing transactions Cash Flow from Investing FINANCING Increase in common stock Decrease in short-term borrowing Decrease in long-term borrowing Acquisition of common stock Dividends Other financing transactions Cash Flow from Financing Change in Cash CashBeginning of year Cash-End of Year $ (79) (6) $(85) $ (63) (2) $ (65) $ (59) (3) $ (62) $ 40 $ 3 (7) (58) $ 3 (15) (127) (37) 7 $ (69) $204 521 $725 (389) (3) (21) 9 $(364) $ 25 496 $ 521 (21) 12 $(148) $ 263 233 $ 496 Source: Hasbro, Inc., Form 10-K for the Fiscal Years Ended 2002-2004