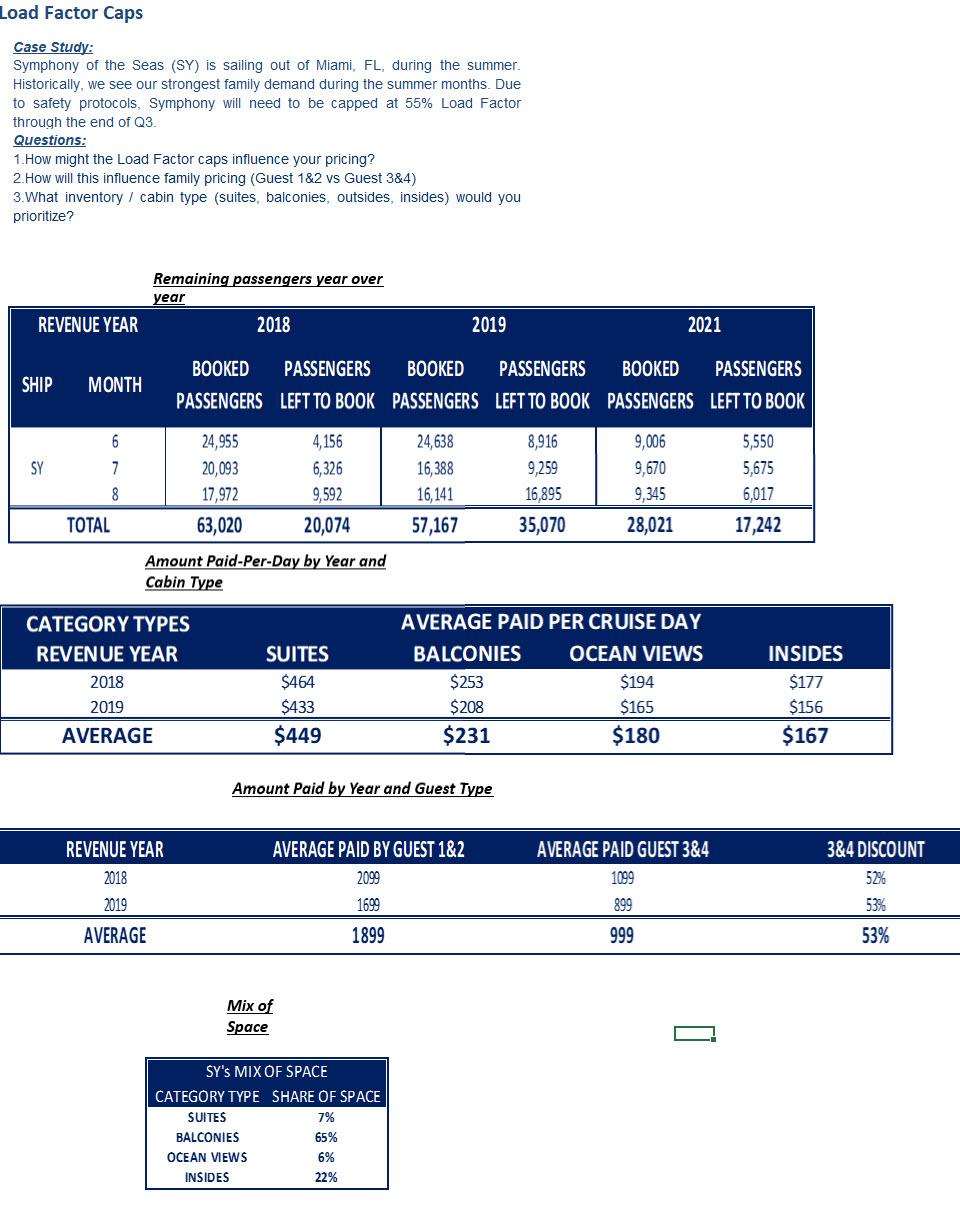


Load Factor Caps Case Study: Symphony of the Seas (SY) is sailing out of Miami, FL, during the summer. Historically, we see our strongest family demand during the summer months. Due to safety protocols, Symphony will need to be capped at 55% Load Factor through the end of Q3. Questions: 1. How might the Load Factor caps influence your pricing? 2. How will this influence family pricing (Guest 1&2 vs Guest 3&4) 3.What inventory / cabin type (suites, balconies, outsides, insides) would you prioritize? Remaining passengers year over year REVENUE YEAR 2018 2019 2021 SHIP MONTH BOOKED PASSENGERS BOOKED PASSENGERS BOOKED PASSENGERS PASSENGERS LEFT TO BOOK PASSENGERS LEFT TO BOOK PASSENGERS LEFT TO BOOK 24,638 8,916 SY 6 7 8 9,259 24,955 20,093 17,972 63,020 4,156 6,326 9,592 20,074 16,388 16,141 57,167 16,895 9,006 9,670 9,345 28,021 5,550 5,675 6,017 17,242 TOTAL 35,070 Amount Paid-Per-Day by Year and Cabin Type CATEGORY TYPES REVENUE YEAR 2018 2019 SUITES $464 $433 $449 AVERAGE PAID PER CRUISE DAY BALCONIES OCEAN VIEWS $253 $194 $208 $165 $231 $180 INSIDES $177 $156 $167 AVERAGE Amount Paid by Year and Guest Type REVENUE YEAR 2018 2019 AVERAGE PAID BY GUEST 1&2 2099 1699 1899 AVERAGE PAID GUEST 3&4 1099 899 999 3&4 DISCOUNT 52% 53% 53% AVERAGE Mix of Space [] SY'S MIX OF SPACE CATEGORY TYPE SHARE OF SPACE SUITES 7% BALCONIES 65% OCEAN VIEWS 6% INSIDES 22% Load Factor Caps Case Study: Symphony of the Seas (SY) is sailing out of Miami, FL, during the summer. Historically, we see our strongest family demand during the summer months. Due to safety protocols, Symphony will need to be capped at 55% Load Factor through the end of Q3. Questions: 1. How might the Load Factor caps influence your pricing? 2. How will this influence family pricing (Guest 1&2 vs Guest 3&4) 3.What inventory / cabin type (suites, balconies, outsides, insides) would you prioritize? REVENUE YEAR Remaining passengers year over year 2018 2019 2021 BOOKED PASSENGERS BOOKED PASSENGERS BOOKED PASSENGERS PASSENGERS LEFT TO BOOK PASSENGERS LEFT TO BOOK PASSENGERS LEFT TO BOOK SHIP MONTH 6 7 SY 24955 20,093 17972 63,020 4.156 6.325 9.592 20,074 24,538 15,388 15.141 57,167 8,916 9.259 15.995 35,070 9,006 9,670 9.345 28,021 5.550 5,575 5017 17,242 8 TOTAL Amount Paid-Per-Day by Year and Cabin Type CATEGORY TYPES REVENUE YEAR 2018 2019 AVERAGE SUITES $464 $433 $ 449 AVERAGE PAID PER CRUISE DAY BALCONIES OCEAN VIEWS $253 $194 $208 $165 $231 $180 INSIDES $177 $156 $167 Amount Paid by Year and Guest Type AVERAGE PAID GUEST 3&4 1099 REVENUE YEAR 2018 2019 AVERAGE AVERAGE PAID BY GUEST 1&2 2099 1699 1899 3&4 DISCOUNT 52% 53% 53% 899 999 Mix of Space SY'S MIX OF SPACE CATEGORY TYPE SHARE OF SPACE SUITES 7% BALCONIES 65% OCEAN VIEWS 6% INSIDES 22% Load Factor Caps Case Study: Symphony of the Seas (SY) is sailing out of Miami, FL, during the summer. Historically, we see our strongest family demand during the summer months. Due to safety protocols, Symphony will need to be capped at 55% Load Factor through the end of Q3. Questions: 1. How might the Load Factor caps influence your pricing? 2. How will this influence family pricing (Guest 1&2 vs Guest 3&4) 3.What inventory / cabin type (suites, balconies, outsides, insides) would you prioritize? REVENUE YEAR Remaining passengers year over year 2018 2019 2021 BOOKED PASSENGERS BOOKED PASSENGERS BOOKED PASSENGERS PASSENGERS LEFT TO BOOK PASSENGERS LEFT TO BOOK PASSENGERS LEFT TO BOOK SHIP MONTH 6 7 SY 24955 20,093 17972 63,020 4.156 6.325 9.592 20,074 24,538 15,388 15.141 57,167 8,916 9.259 15.995 35,070 9,006 9,670 9.345 28,021 5.550 5,575 5017 17,242 8 TOTAL Amount Paid-Per-Day by Year and Cabin Type CATEGORY TYPES REVENUE YEAR 2018 2019 AVERAGE SUITES $464 $433 $ 449 AVERAGE PAID PER CRUISE DAY BALCONIES OCEAN VIEWS $253 $194 $208 $165 $231 $180 INSIDES $177 $156 $167 Amount Paid by Year and Guest Type AVERAGE PAID GUEST 3&4 1099 REVENUE YEAR 2018 2019 AVERAGE AVERAGE PAID BY GUEST 1&2 2099 1699 1899 3&4 DISCOUNT 52% 53% 53% 899 999 Mix of Space SY'S MIX OF SPACE CATEGORY TYPE SHARE OF SPACE SUITES 7% BALCONIES 65% OCEAN VIEWS 6% INSIDES 22% Load Factor Caps Case Study: Symphony of the Seas (SY) is sailing out of Miami, FL, during the summer. Historically, we see our strongest family demand during the summer months. Due to safety protocols, Symphony will need to be capped at 55% Load Factor through the end of Q3. Questions: 1. How might the Load Factor caps influence your pricing? 2. How will this influence family pricing (Guest 1&2 vs Guest 3&4) 3.What inventory / cabin type (suites, balconies, outsides, insides) would you prioritize? Remaining passengers year over year REVENUE YEAR 2018 2019 2021 SHIP MONTH BOOKED PASSENGERS BOOKED PASSENGERS BOOKED PASSENGERS PASSENGERS LEFT TO BOOK PASSENGERS LEFT TO BOOK PASSENGERS LEFT TO BOOK 24,638 8,916 SY 6 7 8 9,259 24,955 20,093 17,972 63,020 4,156 6,326 9,592 20,074 16,388 16,141 57,167 16,895 9,006 9,670 9,345 28,021 5,550 5,675 6,017 17,242 TOTAL 35,070 Amount Paid-Per-Day by Year and Cabin Type CATEGORY TYPES REVENUE YEAR 2018 2019 SUITES $464 $433 $449 AVERAGE PAID PER CRUISE DAY BALCONIES OCEAN VIEWS $253 $194 $208 $165 $231 $180 INSIDES $177 $156 $167 AVERAGE Amount Paid by Year and Guest Type REVENUE YEAR 2018 2019 AVERAGE PAID BY GUEST 1&2 2099 1699 1899 AVERAGE PAID GUEST 3&4 1099 899 999 3&4 DISCOUNT 52% 53% 53% AVERAGE Mix of Space [] SY'S MIX OF SPACE CATEGORY TYPE SHARE OF SPACE SUITES 7% BALCONIES 65% OCEAN VIEWS 6% INSIDES 22% Load Factor Caps Case Study: Symphony of the Seas (SY) is sailing out of Miami, FL, during the summer. Historically, we see our strongest family demand during the summer months. Due to safety protocols, Symphony will need to be capped at 55% Load Factor through the end of Q3. Questions: 1. How might the Load Factor caps influence your pricing? 2. How will this influence family pricing (Guest 1&2 vs Guest 3&4) 3.What inventory / cabin type (suites, balconies, outsides, insides) would you prioritize? REVENUE YEAR Remaining passengers year over year 2018 2019 2021 BOOKED PASSENGERS BOOKED PASSENGERS BOOKED PASSENGERS PASSENGERS LEFT TO BOOK PASSENGERS LEFT TO BOOK PASSENGERS LEFT TO BOOK SHIP MONTH 6 7 SY 24955 20,093 17972 63,020 4.156 6.325 9.592 20,074 24,538 15,388 15.141 57,167 8,916 9.259 15.995 35,070 9,006 9,670 9.345 28,021 5.550 5,575 5017 17,242 8 TOTAL Amount Paid-Per-Day by Year and Cabin Type CATEGORY TYPES REVENUE YEAR 2018 2019 AVERAGE SUITES $464 $433 $ 449 AVERAGE PAID PER CRUISE DAY BALCONIES OCEAN VIEWS $253 $194 $208 $165 $231 $180 INSIDES $177 $156 $167 Amount Paid by Year and Guest Type AVERAGE PAID GUEST 3&4 1099 REVENUE YEAR 2018 2019 AVERAGE AVERAGE PAID BY GUEST 1&2 2099 1699 1899 3&4 DISCOUNT 52% 53% 53% 899 999 Mix of Space SY'S MIX OF SPACE CATEGORY TYPE SHARE OF SPACE SUITES 7% BALCONIES 65% OCEAN VIEWS 6% INSIDES 22% Load Factor Caps Case Study: Symphony of the Seas (SY) is sailing out of Miami, FL, during the summer. Historically, we see our strongest family demand during the summer months. Due to safety protocols, Symphony will need to be capped at 55% Load Factor through the end of Q3. Questions: 1. How might the Load Factor caps influence your pricing? 2. How will this influence family pricing (Guest 1&2 vs Guest 3&4) 3.What inventory / cabin type (suites, balconies, outsides, insides) would you prioritize? REVENUE YEAR Remaining passengers year over year 2018 2019 2021 BOOKED PASSENGERS BOOKED PASSENGERS BOOKED PASSENGERS PASSENGERS LEFT TO BOOK PASSENGERS LEFT TO BOOK PASSENGERS LEFT TO BOOK SHIP MONTH 6 7 SY 24955 20,093 17972 63,020 4.156 6.325 9.592 20,074 24,538 15,388 15.141 57,167 8,916 9.259 15.995 35,070 9,006 9,670 9.345 28,021 5.550 5,575 5017 17,242 8 TOTAL Amount Paid-Per-Day by Year and Cabin Type CATEGORY TYPES REVENUE YEAR 2018 2019 AVERAGE SUITES $464 $433 $ 449 AVERAGE PAID PER CRUISE DAY BALCONIES OCEAN VIEWS $253 $194 $208 $165 $231 $180 INSIDES $177 $156 $167 Amount Paid by Year and Guest Type AVERAGE PAID GUEST 3&4 1099 REVENUE YEAR 2018 2019 AVERAGE AVERAGE PAID BY GUEST 1&2 2099 1699 1899 3&4 DISCOUNT 52% 53% 53% 899 999 Mix of Space SY'S MIX OF SPACE CATEGORY TYPE SHARE OF SPACE SUITES 7% BALCONIES 65% OCEAN VIEWS 6% INSIDES 22%


