Answered step by step
Verified Expert Solution
Link Copied!

Question

1 Approved Answer

Load the GSS18SSDS-A data set in SPSS and use the frequency command (as described in the demonstration) to produce a frequency table for the variable
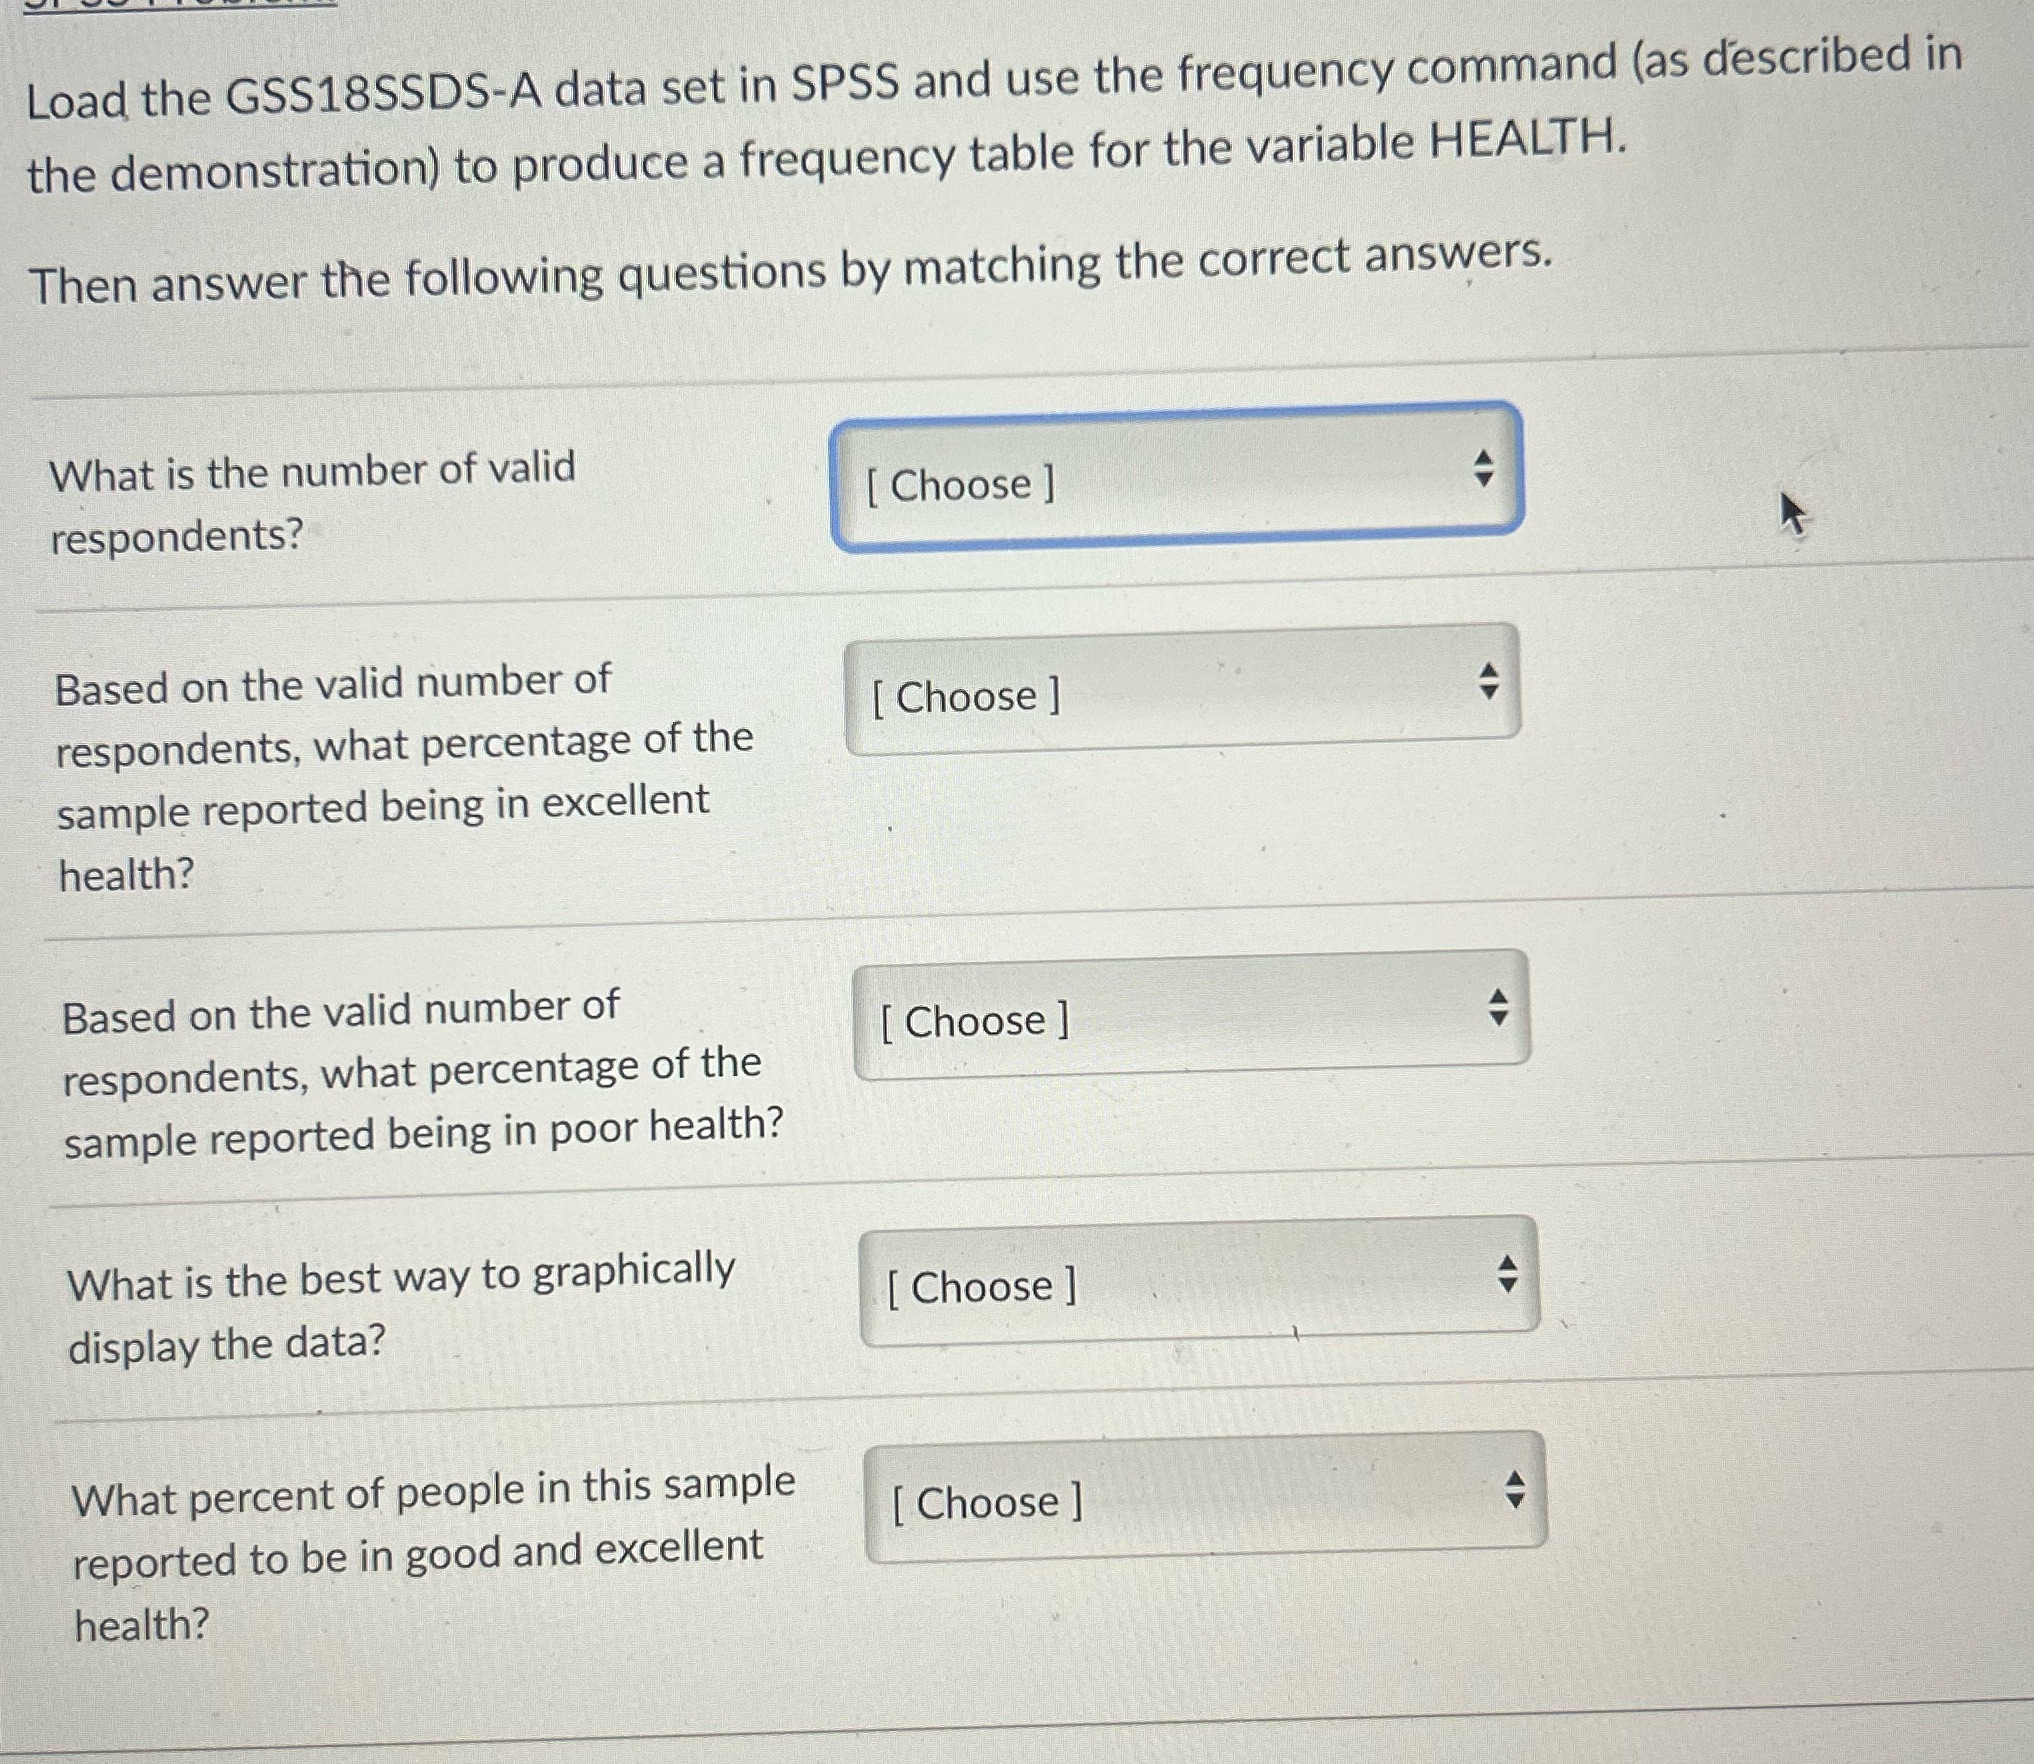
image text in transcribed
Load the GSS18SSDS-A data set in SPSS and use the frequency command (as described in the demonstration) to produce a frequency table for the variable HEALTH. Then answer the following questions by matching the correct answers. What is the number of valid [ Choose ] respondents? Based on the valid number of [ Choose ] respondents, what percentage of the sample reported being in excellent health? Based on the valid number of [ Choose ] respondents, what percentage of the sample reported being in poor health? What is the best way to graphically [ Choose ] display the data? What percent of people in this sample [ Choose ] reported to be in good and excellent health

Step by Step Solution

There are 3 Steps involved in it

Step: 1

blur-text-image

Get Instant Access to Expert-Tailored Solutions

See step-by-step solutions with expert insights and AI powered tools for academic success

Step: 2

blur-text-image

Step: 3

blur-text-image

Ace Your Homework with AI

Get the answers you need in no time with our AI-driven, step-by-step assistance

Get Started

Recommended Textbook for

Introduction to graph theory

Authors: Douglas B. West

2nd edition

131437372, 978-0131437371

More Books

Students also viewed these Mathematics questions