

Question
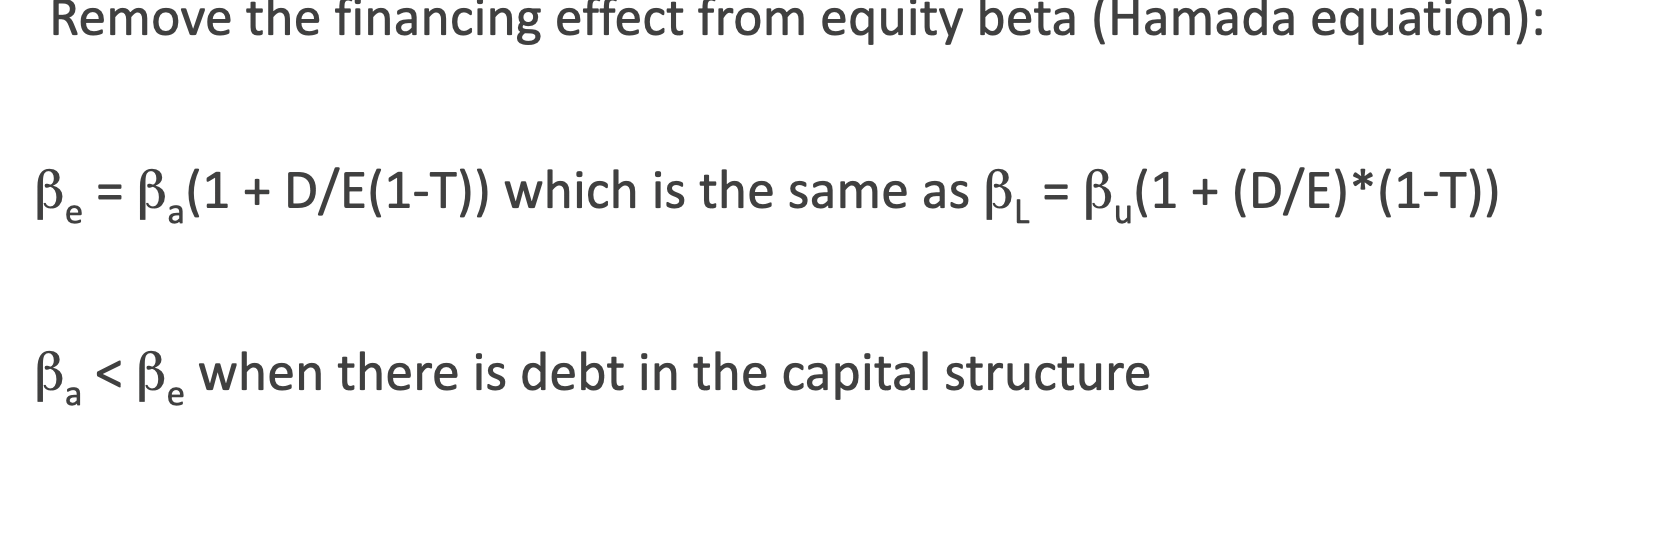
Lockheed Martin Northrop Grumman Boeing % of sales derived from defense and space operations 0.93 0.91 0.46 BETAS Value Line 0.60 0.70 1.05 Calculated against
Lockheed Martin | Northrop Grumman | Boeing | |
% of sales derived from defense and space operations | 0.93 | 0.91 | 0.46 |
BETAS | |||
Value Line | 0.60 | 0.70 | 1.05 |
Calculated against the S&P 500 | |||
5 years | 0.36 | 0.34 | 0.80 |
21 months | 0.38 | 0.31 | 1.03 |
60 days | 0.34 | 0.27 | 1.45 |
Calculated against the NYSE Composite | |||
5 years | 0.49 | 0.43 | 1.00 |
21 months | 0.44 | 0.36 | 1.17 |
60 days | 0.37 | 0.30 | 1.62 |
Tax rate | 35.00% | 35.00% | 35.00% |
Market value Debt/Equity ratios | 0.41 | 0.64 | 0.535 |
Market Risk Premium | 6.00% | 6.00% | 6.00% |
Risk Free Rate | 4.56% | 4.56% | 4.56% |
Debt Amount ($Millions) | Coupon | Maturity | Price ($) | Yield to Maturity |
$202 | 7.63% | 2/15/05 | 106.175 | 3.91% |
$298 | 6.63% | 6/1/05 | 105.593 | 3.39% |
$249 | 6.88% | 11/1/06 | 110.614 | 3.48% |
$175 | 8.10% | 11/15/06 | 112.650 | 4.05% |
$349 | 9.75% | 4/1/12 | 129.424 | 5.47% |
$597 | 6.13% | 2/15/13 | 103.590 | 4.66% |
$398 | 8.75% | 8/15/21 | 127.000 | 6.24% |
$300 | 7.95% | 8/15/24 | 126.951 | 5.73% |
$247 | 7.25% | 6/15/25 | 114.506 | 6.05% |
$249 | 8.75% | 9/15/31 | 131.000 | 6.34% |
$173 | 8.63% | 11/15/31 | 138.974 | 5.81% |
$393 | 6.13% | 2/15/33 | 103.826 | 5.85% |
$300 | 6.63% | 2/15/38 | 106.715 | 6.15% |
$100 | 7.50% | 8/15/42 | 119.486 | 6.17% |
$173 | 7.83% | 4/15/43 | 132.520 | 5.78% |
$125 | 6.88% | 10/15/43 | 110.084 | 6.19% |
Boeing | Lockheed Martin | Northrop Grumman | |
% of sales derived from defense and space operations | 46% | 93% | 91% |
BETAS | |||
Value Line | 1.05 | 0.60 | 0.70 |
Calculated against the S&P 500 (End date, June 2013) | |||
5 years | 0.80 | 0.36 | 0.34 |
21 months | 1.05 | 0.38 | 0.31 |
60 days | 1.45 | 0.34 | 0.27 |
Calculated against the NYSE Composite (end date June 2013) | |||
5 years | 1.00 | 0.49 | 0.44 |
21 months | 1.17 | 0.44 | 0.36 |
60 days | 1.62 | 0.37 | 0.30 |
Tax rate | 0.35 | 0.35 | 0.35 |
Market value Debt/Equity ratios | 0.535 | 0.41 | 0.64 |
Market Risk Premium | 6% | 6% | 6% |
Risk Free Rate | 4.56% |
Debt Amount (millions) | Coupon | Maturity | Price | Yield to Maturity |
$202 | 7.625% | 2/15/2005 | 106.175 | 3.911% |
$298 | 6.625% | 6/1/2005 | 105.593 | 3.393% |
$249 | 6.875% | 11/1/2006 | 110.614 | 3.475% |
$175 | 8.1% | 11/15/2006 | 112.65 | 4.049% |
$349 | 9.75% | 4/1/2012 | 129.424 | 5.47% |
$597 | 6.125% | 2/15/2013 | 103.59 | 4.657% |
$398 | 8.75% | 8/15/2021 | 127.0 | 6.239% |
$300 | 7.95% | 8/15/2024 | 126.951 | 5.732% |
$247 | 7.25% | 6/15/2025 | 114.506 | 6.047% |
$249 | 8.75% | 9/15/2031 | 131.0 | 6.337% |
$173 | 8.625% | 11/15/2031 | 138.974 | 5.805% |
$393 | 6.125% | 2/15/2033 | 103.826 | 5.85% |
$300 | 6.625% | 2/15/2038 | 106.715 | 6.153% |
$100 | 7.5% | 8/15/2042 | 119.486 | 6.173% |
$173 | 7.825% | 4/15/2043 | 132.52 | 5.777% |
$125 | 6.875% | 10/15/2043 | 110.084 | 6.191% |
Step by Step Solution
There are 3 Steps involved in it
Step: 1

Get Instant Access to Expert-Tailored Solutions
See step-by-step solutions with expert insights and AI powered tools for academic success
Step: 2

Step: 3
Ace Your Homework with AI
Get the answers you need in no time with our AI-driven, step-by-step assistance
Get Started
Fundamentals of Financial Management
Authors: Eugene F. Brigham, Joel F. Houston
Concise 6th Edition
324664559, 978-0324664553