

Question
Long-term notes payable: $8,242 and Other Liabilities is &8,589 Question: Using these financial statements find the following: a. NOPAT b. Net operating working capital c.
Long-term notes payable: $8,242 and Other Liabilities is &8,589
Question: Using these financial statements find the following:
a. NOPAT
b. Net operating working capital
c. Free Cash Flow
d. Return on invested capital
e. Capital requirement ratio
Please show calculations.
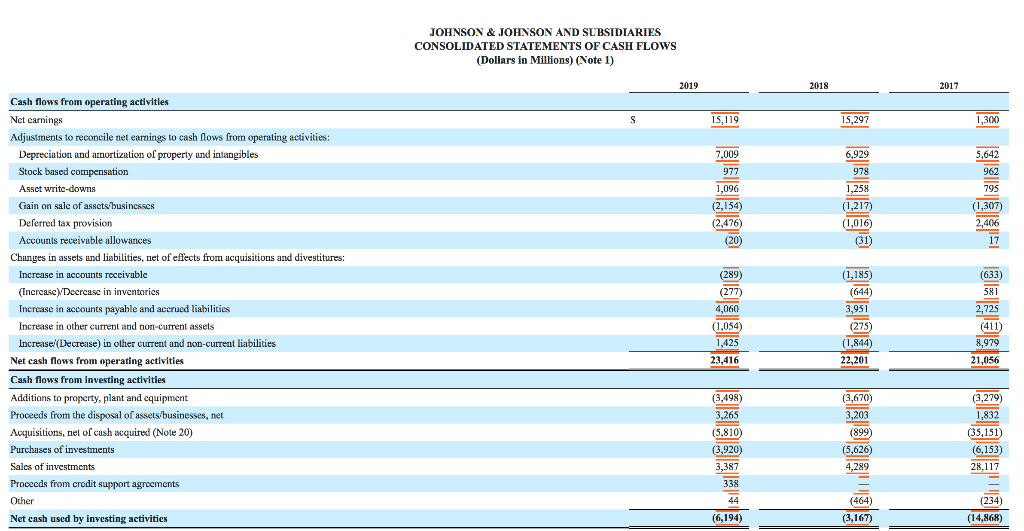
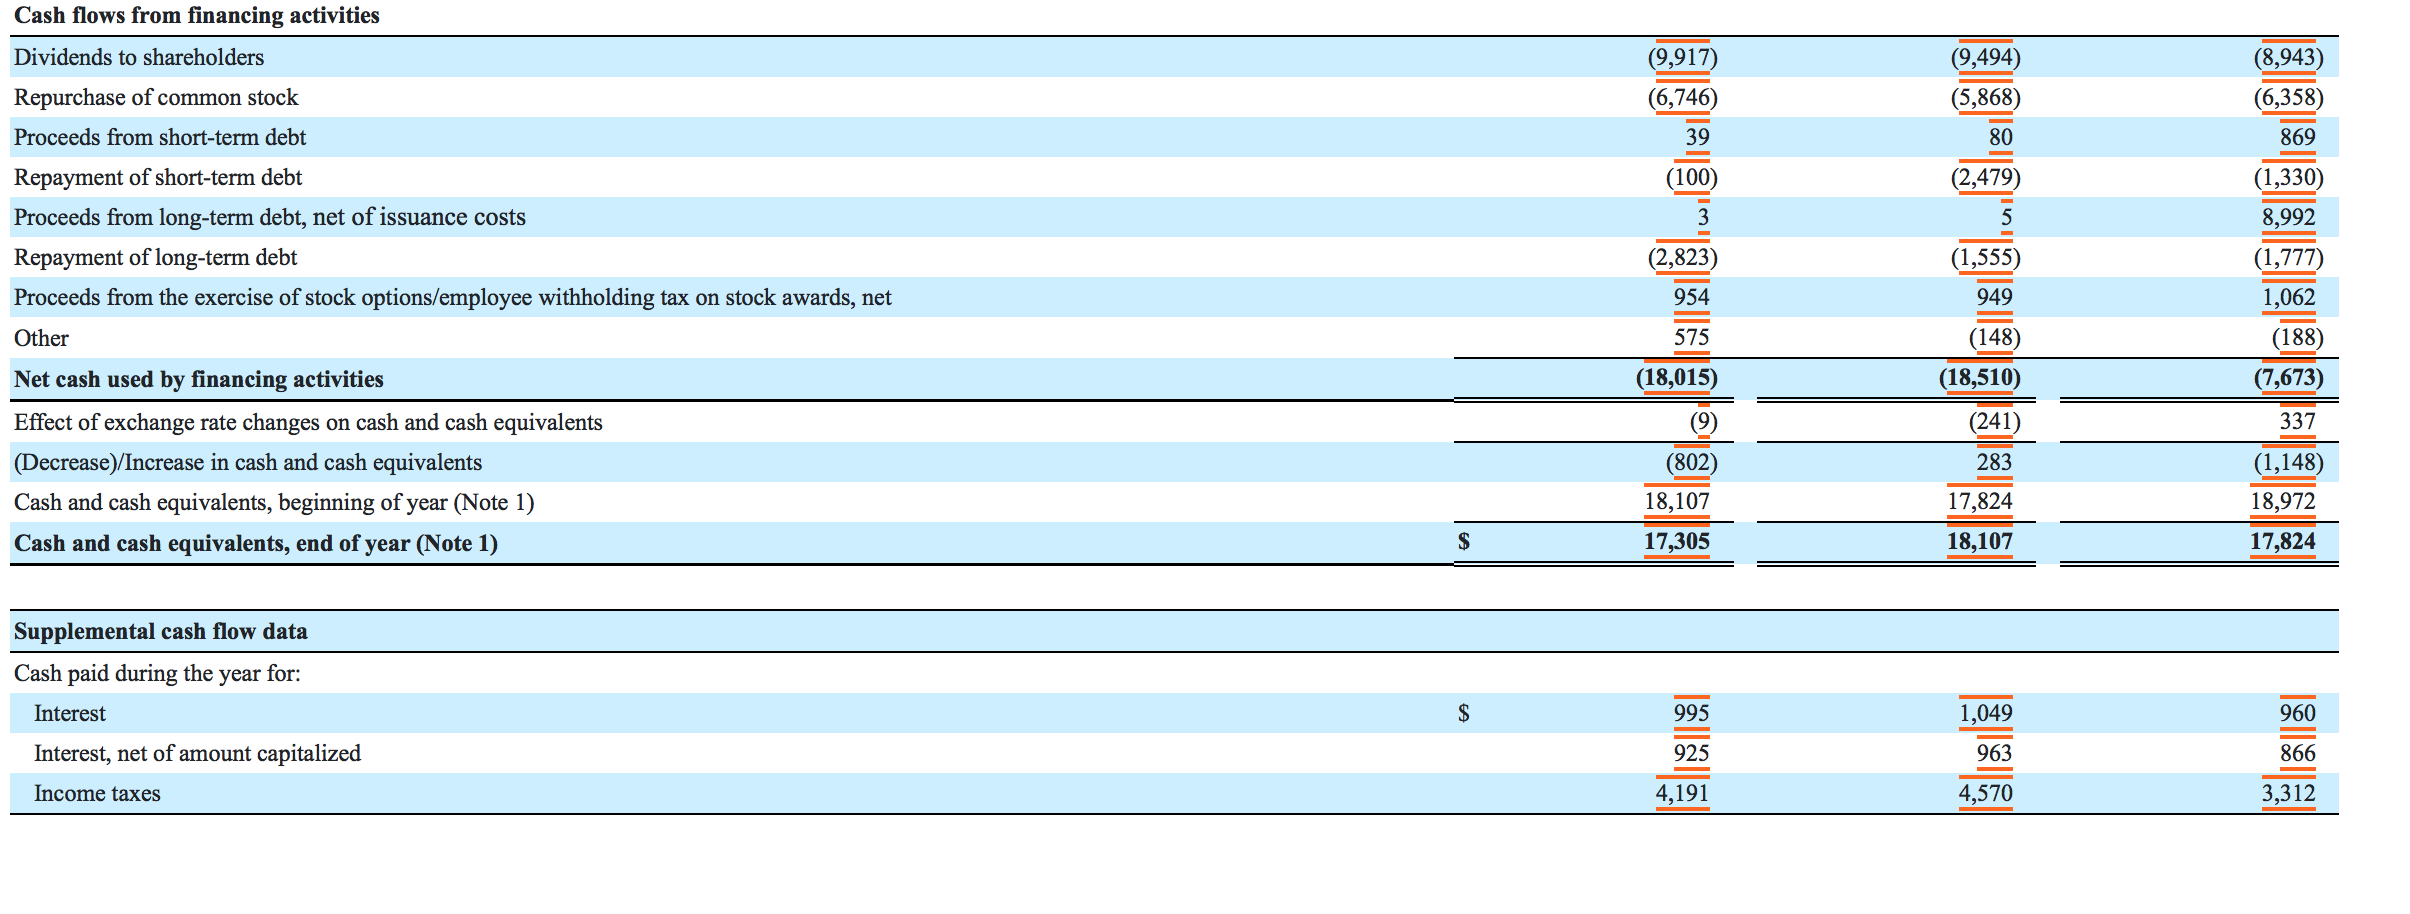
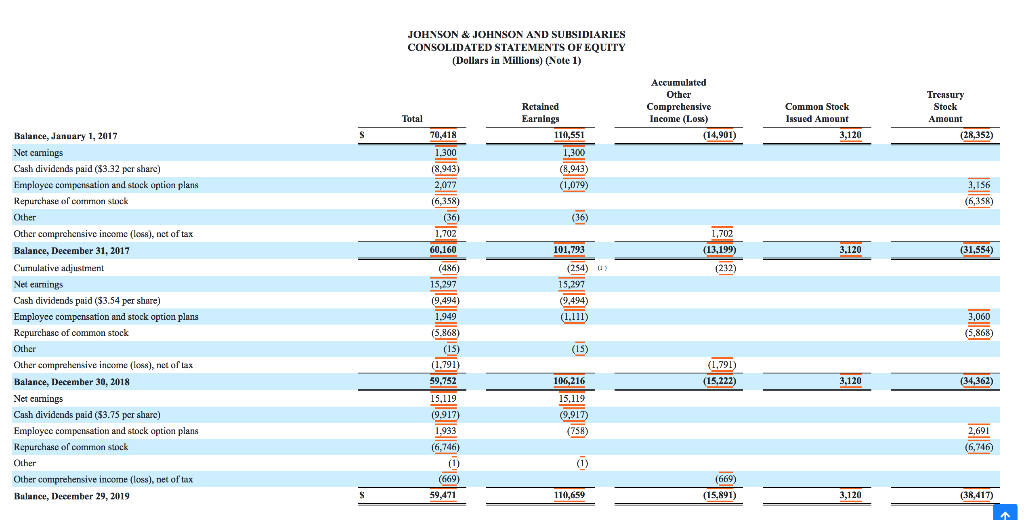
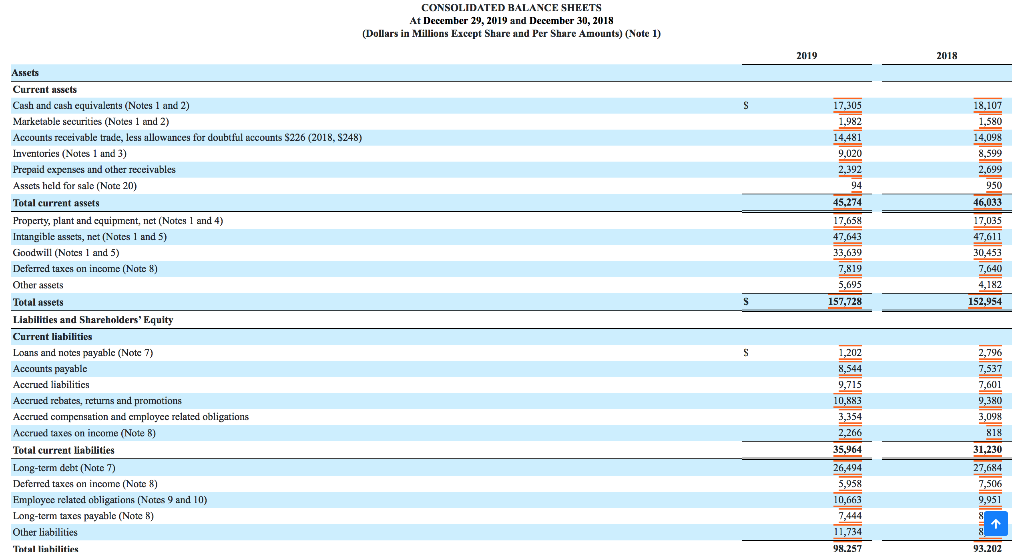
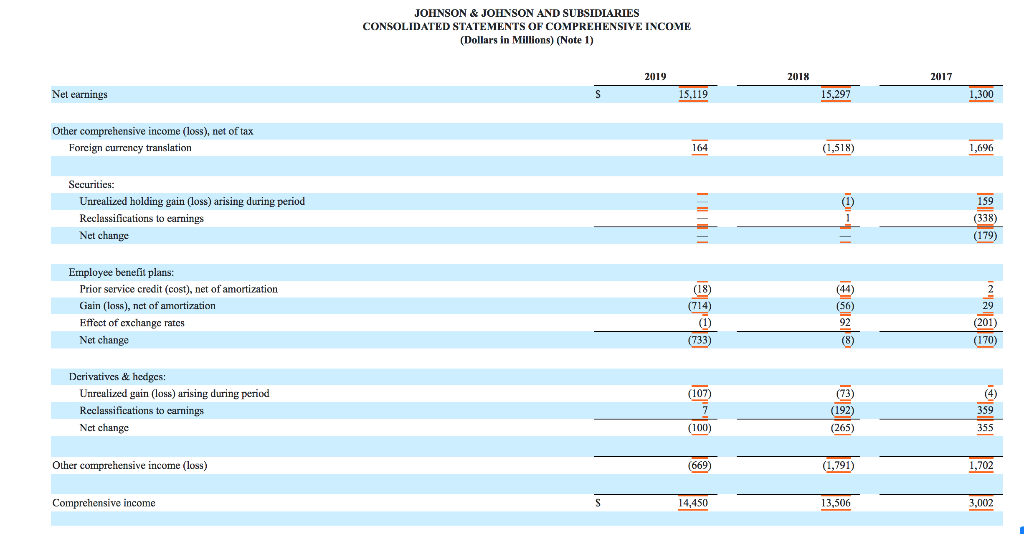
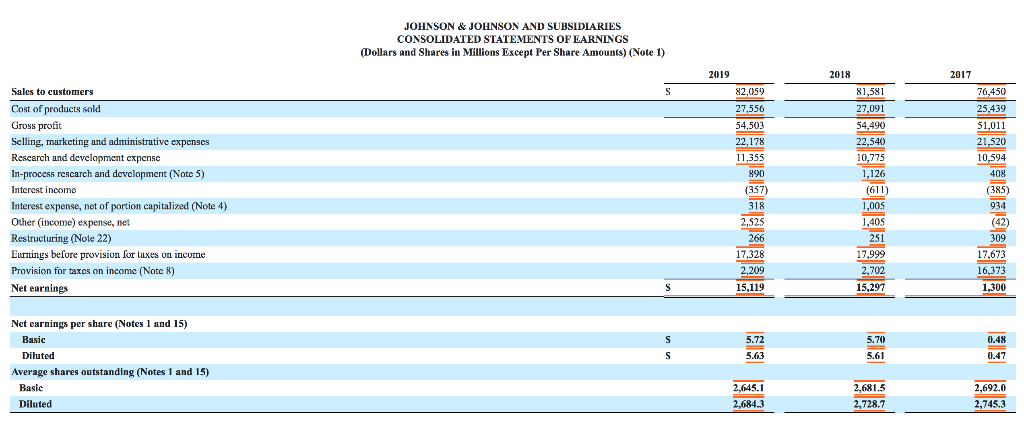
JOHNSON & JOHNSON AND SUBSIDIARIES CONSOLIDATED STATEMENTS OF CASH FLOWS (Dollars in Millions) (Note 1) 2019 2018 2017 S 15,119 15,297 1,300 5,642 962 7,009 977 1,096 (2,134) (2,476) 6,929 978 1,258 (1,217) (1,016) (31) 795 (1,307) 2,406 Cash flows from operating activities Net earnings Adjustments to reconcile net earnings to cash flows from operating activities: Depreciation and accortization of property and intangibles Stock based compensation Asset write-downs Gain on sale of assets/businesses Deferred tax provision Accounts receivable allowances Changes in assets and liabilities, net of effects from acquisitions and divestitures: Increase in accounts receivable (Increase)Decrease in inventories Increase in accounts payable and accrued liabilities Increase in other current and non-current assets Increase (Decrease) in other current and non-current liabilities Net cash flows from operating activities Cash flows from investing activities Additions to property, plant and equipment Proceeds from the disposal of assets/businesses, net Acquisitions, nel of cash acquired (Note 20) Purchases of investments Sales of investments Proceeds from credit support agreements (289) (277) 4,060 (1,054) 1,425 (1,185) (644) 3,951 (275) (1,844) 22,201 (633) 581 2,725 (411) 8,979 21,056 23.416 (3,498) 3.265 (5,810) (3,920) 3,387 (3,670) 3,203 (899) (5,626) 4,289 (3,279) 1,832 (35,151) (6,153) 28,117 338 Other (464) (3,167) (234) (14,868) Net cash used by investing activities (6,194) Cash flows from financing activities (9,917) (9,494) Dividends to shareholders Repurchase of common stock Proceeds from short-term debt (6,746) (5,868) (8,943) (6,358) 869 39 80 Repayment of short-term debt (2,479) (1,330) Proceeds from long-term debt, net of issuance costs 8,992 Repayment of long-term debt Proceeds from the exercise of stock options/employee withholding tax on stock awards, net (2,823 (1,555) (1,777) 1,062 954 949 Other 575 (148) (18,510) (188) (7,673) Net cash used by financing activities Effect of exchange rate changes on cash and cash equivalents 337 (Decrease) Increase in cash and cash equivalents Cash and cash equivalents, beginning of year (Note 1) Cash and cash equivalents, end of year (Note 1) (18,015) (9) (802) 18,107 17,305 (241) 283 17,824 (1,148) 18,972 18,107 17,824 Supplemental cash flow data Cash paid during the year for: Interest Interest, net of amount capitalized 995. 1,049 960 925 866 963 4,570 Income taxes 4,191 3,312 JOHNSON & JOHNSON AND SUBSIDIARIES CONSOLIDATED STATEMENTS OF EQUITY (Dollars in Millions) (Note 1) Accumulated Other Comprehensive Income (Loss) (14,901) Retained Earplugs 110,551 Total Common Stock Issued Amount 3,120 Treasury Stock Amount (28,352) 70,418 1.300 (8.943) 2,077 (6,358) 1,300 (8.943) (1,079) 3,156 (6,358) 136) 1.702 60.160 101,793 1,702 (13,199) (232) 3.120 (31,554) Balance, January 1, 2017 Net camings Cash dividends paid ($3.32 per share) Employee compensation and stock option plans Repurchase of common stock Other Other comprehensive income (Loss), net of tax Balance, December 31, 2017 Cumulative adjustment Net earnings Cash dividends paid ($3.54 per share) Employee compensation and stock option plans Repurchase of common stock Other Other comprehensive income (Loss), net of tax Balance, December 30, 2018 Net camings Cash dividends paid ($3.75 per share) Employee compensation and stock option plans Repurchase of common stock Other Other comprehensive income (loss), net of tax Bulance, December 29, 2019 (254) 03 15,297 (9,494) (1,111) (486) 15,297 (9,494) 1.949 (5.868) (15) (1.791) 59,752 3,060 5,868) (15) 3,120 (34,362) 15,119 (9.917) 106,216 15,119 (9,917) (758) 1.933 2,691 (6,746) (6,746) (1) (669) (669) (15,891) $ 59,471 110,659 3.120 (38,417) CONSOLIDATED BALANCE SHEETS At December 29, 2019 and December 30, 2018 (Dollars in Millions Except Share and Per Share Amounts) (Note 1) 2019 2018 Assets S 18,107 1.580 14,098 8,599 2,699 950 Current assets Cash and cush equivalents (Notes 1 and 2) Marketable securities (Notes 1 and 2) Accounts receivable trude, less allowances for doubtful accounts S226 (2018, S248) Inventories (Notes 1 und 3) Prepaid expenses and other receivables Assets held for sale (Note 20) Total current assets Property, plant and equipment, nct (Notes 1 and 4) Intangible assets, net (Notes 1 and 5) Goodwill (Notes 1 and 5) Deferred taxes on income (Note 8) Other assets Total assets 17,305 1,982 14,481 9,020 2,392 94 45,274 17,658 47,643 33,639 7,819 5,695 157,728 46,033 17,035 47,611 30,453 7,640 4,182 152,954 S Liabilities and Shareholders' Equity Current liabilities 2,796 7,537 7,601 9,380 3,098 Loans and notes payable (Note 7) Accounts payable Accrued liabilities Accrued rehates, returns and promotions Accrued compensation and cmployce related obligations Accrued taxes on income (Note 8) Total current liabilities Long-term debt (Note 7) Deferred taxes on income (Note 8) Employee related obligations (Notes 9 and 10) Long-term taxes payable (Note 8) Other liabilities 1,202 8,544 9,715 10,883 3,354 2,266 35,964 26,494 5,958 10,663 818 31,230 27,684 7,506 9,951 11,734 98.257 Total liahilities 93.202 JOHNSON & JOHNSON AND SUBSIDIARIES CONSOLIDATED STATEMENTS OF COMPREHENSIVE INCOME (Dollars in Millions) (Note 1) 2019 2018 2017 Nel earnings S 15,119 15,297 1,300 Other comprehensive income (loss), net of tax Foreign currency translation (1,518) 1,696 Securities: Unrealized holding gain (loss) arising during period Reclassifications to earrings Net change 3-1 159 (338) (179) Ernployee benefit plans: Prior service credit (cost), net of amortization Gain (loss), nct of amortization Effect of exchange rates Net change 941 EST. Derivatives & hedges: Unrealized gain (loss) arising during period Reclassifications to earnings Net changc Elle (265) Other comprehensive income (loss) (1,791) 1,702 Comprehensive income 13,506 3,002 JOHNSON & JOHNSON AND SUBSIDIARIES CONSOLIDATED STATEMENTS OF EARNINGS (Dollars and Shares in Millions Except Per Share Amounts) (Note 1) 2018 2017 S 2019 82,059 27,556 54,503 22,178 11,355 890 76,450 25,439 51,011 21.520 10,594 Sales to customers Cost of products sold Gross profit Selling, marketing and administrative expenses Research and development expense In-process rescarch and development (Note 5) Interest income Interest expense, net of portion capitalized (Note 4) Other (income) expense, net Restructuring (Note 22) Earnings before provision for laxes on income Provision for taxes on income (Note X) Net earnings (357 81,581 27,091 54,490 22,540 10,775 1,126 (611) 1,005 1,405 251 17,999 2,702 15,297 (385 318 309 2.525 266 17,328 2,209 15,119 17,673 16,373 1,300 S S 5.63 0.47 Net earnings per share (Notes 1 and 15) Basic Diluted Average shares outstanding (Notes 1 and 15) Basie Diluted 2,645.1 2,681.5 2,692.0 2,745.3 2,684.3 JOHNSON & JOHNSON AND SUBSIDIARIES CONSOLIDATED STATEMENTS OF CASH FLOWS (Dollars in Millions) (Note 1) 2019 2018 2017 S 15,119 15,297 1,300 5,642 962 7,009 977 1,096 (2,134) (2,476) 6,929 978 1,258 (1,217) (1,016) (31) 795 (1,307) 2,406 Cash flows from operating activities Net earnings Adjustments to reconcile net earnings to cash flows from operating activities: Depreciation and accortization of property and intangibles Stock based compensation Asset write-downs Gain on sale of assets/businesses Deferred tax provision Accounts receivable allowances Changes in assets and liabilities, net of effects from acquisitions and divestitures: Increase in accounts receivable (Increase)Decrease in inventories Increase in accounts payable and accrued liabilities Increase in other current and non-current assets Increase (Decrease) in other current and non-current liabilities Net cash flows from operating activities Cash flows from investing activities Additions to property, plant and equipment Proceeds from the disposal of assets/businesses, net Acquisitions, nel of cash acquired (Note 20) Purchases of investments Sales of investments Proceeds from credit support agreements (289) (277) 4,060 (1,054) 1,425 (1,185) (644) 3,951 (275) (1,844) 22,201 (633) 581 2,725 (411) 8,979 21,056 23.416 (3,498) 3.265 (5,810) (3,920) 3,387 (3,670) 3,203 (899) (5,626) 4,289 (3,279) 1,832 (35,151) (6,153) 28,117 338 Other (464) (3,167) (234) (14,868) Net cash used by investing activities (6,194) Cash flows from financing activities (9,917) (9,494) Dividends to shareholders Repurchase of common stock Proceeds from short-term debt (6,746) (5,868) (8,943) (6,358) 869 39 80 Repayment of short-term debt (2,479) (1,330) Proceeds from long-term debt, net of issuance costs 8,992 Repayment of long-term debt Proceeds from the exercise of stock options/employee withholding tax on stock awards, net (2,823 (1,555) (1,777) 1,062 954 949 Other 575 (148) (18,510) (188) (7,673) Net cash used by financing activities Effect of exchange rate changes on cash and cash equivalents 337 (Decrease) Increase in cash and cash equivalents Cash and cash equivalents, beginning of year (Note 1) Cash and cash equivalents, end of year (Note 1) (18,015) (9) (802) 18,107 17,305 (241) 283 17,824 (1,148) 18,972 18,107 17,824 Supplemental cash flow data Cash paid during the year for: Interest Interest, net of amount capitalized 995. 1,049 960 925 866 963 4,570 Income taxes 4,191 3,312 JOHNSON & JOHNSON AND SUBSIDIARIES CONSOLIDATED STATEMENTS OF EQUITY (Dollars in Millions) (Note 1) Accumulated Other Comprehensive Income (Loss) (14,901) Retained Earplugs 110,551 Total Common Stock Issued Amount 3,120 Treasury Stock Amount (28,352) 70,418 1.300 (8.943) 2,077 (6,358) 1,300 (8.943) (1,079) 3,156 (6,358) 136) 1.702 60.160 101,793 1,702 (13,199) (232) 3.120 (31,554) Balance, January 1, 2017 Net camings Cash dividends paid ($3.32 per share) Employee compensation and stock option plans Repurchase of common stock Other Other comprehensive income (Loss), net of tax Balance, December 31, 2017 Cumulative adjustment Net earnings Cash dividends paid ($3.54 per share) Employee compensation and stock option plans Repurchase of common stock Other Other comprehensive income (Loss), net of tax Balance, December 30, 2018 Net camings Cash dividends paid ($3.75 per share) Employee compensation and stock option plans Repurchase of common stock Other Other comprehensive income (loss), net of tax Bulance, December 29, 2019 (254) 03 15,297 (9,494) (1,111) (486) 15,297 (9,494) 1.949 (5.868) (15) (1.791) 59,752 3,060 5,868) (15) 3,120 (34,362) 15,119 (9.917) 106,216 15,119 (9,917) (758) 1.933 2,691 (6,746) (6,746) (1) (669) (669) (15,891) $ 59,471 110,659 3.120 (38,417) CONSOLIDATED BALANCE SHEETS At December 29, 2019 and December 30, 2018 (Dollars in Millions Except Share and Per Share Amounts) (Note 1) 2019 2018 Assets S 18,107 1.580 14,098 8,599 2,699 950 Current assets Cash and cush equivalents (Notes 1 and 2) Marketable securities (Notes 1 and 2) Accounts receivable trude, less allowances for doubtful accounts S226 (2018, S248) Inventories (Notes 1 und 3) Prepaid expenses and other receivables Assets held for sale (Note 20) Total current assets Property, plant and equipment, nct (Notes 1 and 4) Intangible assets, net (Notes 1 and 5) Goodwill (Notes 1 and 5) Deferred taxes on income (Note 8) Other assets Total assets 17,305 1,982 14,481 9,020 2,392 94 45,274 17,658 47,643 33,639 7,819 5,695 157,728 46,033 17,035 47,611 30,453 7,640 4,182 152,954 S Liabilities and Shareholders' Equity Current liabilities 2,796 7,537 7,601 9,380 3,098 Loans and notes payable (Note 7) Accounts payable Accrued liabilities Accrued rehates, returns and promotions Accrued compensation and cmployce related obligations Accrued taxes on income (Note 8) Total current liabilities Long-term debt (Note 7) Deferred taxes on income (Note 8) Employee related obligations (Notes 9 and 10) Long-term taxes payable (Note 8) Other liabilities 1,202 8,544 9,715 10,883 3,354 2,266 35,964 26,494 5,958 10,663 818 31,230 27,684 7,506 9,951 11,734 98.257 Total liahilities 93.202 JOHNSON & JOHNSON AND SUBSIDIARIES CONSOLIDATED STATEMENTS OF COMPREHENSIVE INCOME (Dollars in Millions) (Note 1) 2019 2018 2017 Nel earnings S 15,119 15,297 1,300 Other comprehensive income (loss), net of tax Foreign currency translation (1,518) 1,696 Securities: Unrealized holding gain (loss) arising during period Reclassifications to earrings Net change 3-1 159 (338) (179) Ernployee benefit plans: Prior service credit (cost), net of amortization Gain (loss), nct of amortization Effect of exchange rates Net change 941 EST. Derivatives & hedges: Unrealized gain (loss) arising during period Reclassifications to earnings Net changc Elle (265) Other comprehensive income (loss) (1,791) 1,702 Comprehensive income 13,506 3,002 JOHNSON & JOHNSON AND SUBSIDIARIES CONSOLIDATED STATEMENTS OF EARNINGS (Dollars and Shares in Millions Except Per Share Amounts) (Note 1) 2018 2017 S 2019 82,059 27,556 54,503 22,178 11,355 890 76,450 25,439 51,011 21.520 10,594 Sales to customers Cost of products sold Gross profit Selling, marketing and administrative expenses Research and development expense In-process rescarch and development (Note 5) Interest income Interest expense, net of portion capitalized (Note 4) Other (income) expense, net Restructuring (Note 22) Earnings before provision for laxes on income Provision for taxes on income (Note X) Net earnings (357 81,581 27,091 54,490 22,540 10,775 1,126 (611) 1,005 1,405 251 17,999 2,702 15,297 (385 318 309 2.525 266 17,328 2,209 15,119 17,673 16,373 1,300 S S 5.63 0.47 Net earnings per share (Notes 1 and 15) Basic Diluted Average shares outstanding (Notes 1 and 15) Basie Diluted 2,645.1 2,681.5 2,692.0 2,745.3 2,684.3Step by Step Solution
There are 3 Steps involved in it
Step: 1

Get Instant Access to Expert-Tailored Solutions
See step-by-step solutions with expert insights and AI powered tools for academic success
Step: 2

Step: 3
Ace Your Homework with AI
Get the answers you need in no time with our AI-driven, step-by-step assistance
Get Started
Governing Global Finance
Authors: Michele Fratianni, Paolo Savona
1st Edition
1138742147, 978-1138742147