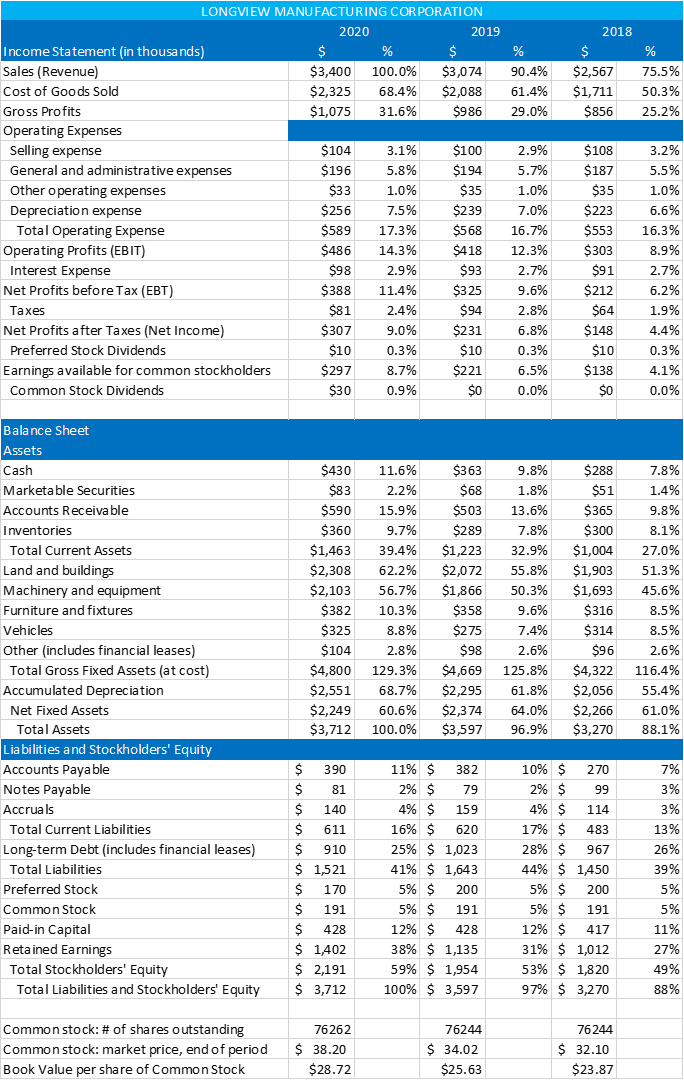
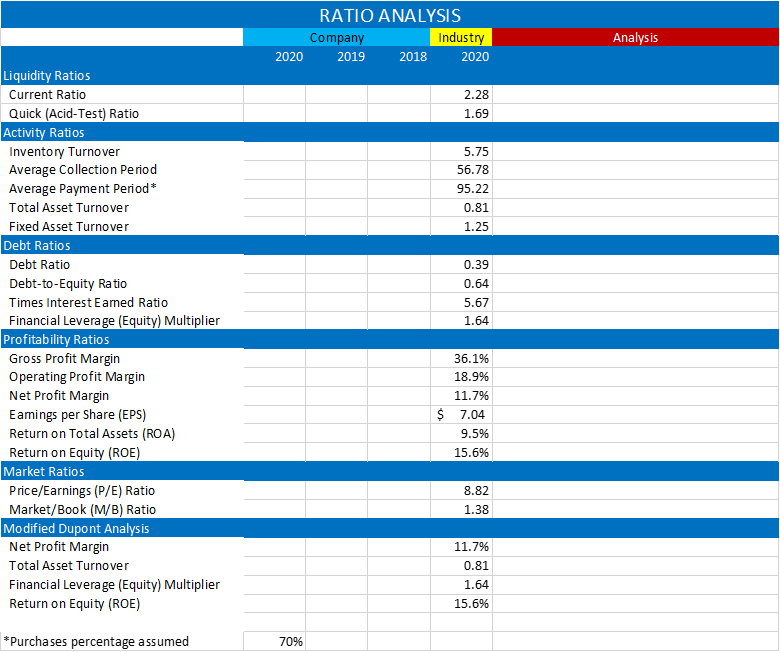
LONGVIEW MANUFACTURING CORPORATION 2020 2019 2018 % % % 100.0% 90.4% 75.5% $ $3,400 $2,325 $1,075 $ $3,074 $2,088 $986 $ $2,567 $1,711 $856 68.4% 50.3% 61.4% 29.0% 31.6% 25.2% 3.1% 2.9% 3.2% Income Statement in thousands) Sales (Revenue) Cost of Goods Sold Gross Profits Operating Expenses Selling expense General and administrative expenses Other operating expenses Depreciation expense Total Operating Expense Operating profits (EBIT) Interest Expense Net Profits before Tax (EBT) 5.8% 5.7% 5.5% 1.0% 1.0% 1.0% 7.5% 7.0% 6.6% 17.3% 16.7% 16.3% 14.3% 12.3% 8.9% $104 $196 $33 $256 $589 $486 $98 $388 $81 $307 $10 $ 297 $30 2.9% $100 $194 $35 $239 $568 $418 $93 $325 $94 $231 $ $10 $221 $0 2.7% $108 $187 $35 $223 $553 $303 $91 $212 $64 $ 148 $10 $138 $0 2.7% 11.4% 6.2% 9.6% 2.8% Taxes 2.4% 1.9% Net Profits after Taxes (Net Income) 9.0% 6.8% 4.4% Preferred Stock Dividends 0.3% 0.3% 0.3% Earnings available for common stockholders 8.7% 6.5% 4.1% Common Stock Dividends 0.9% 0.0% 0.0% Balance Sheet Assets Cash 11.6% 9.8% 7.8% Marketable Securities 2.2% 1.8% 1.4% Accounts Receivable 15.9% 13.6% 9.8% Inventories 9.7% 7.8% 8.1% Total Current Assets 39.4% 32.9% 27.0% 62.2% 55.8% 51.3% Land and buildings Machinery and equipment Furniture and fixtures 56.7% 50.3% 45.6% $430 $83 $590 $360 $1,463 $2,308 $2,103 $382 $325 $104 $4,800 $2,551 $2,249 $3,712 $363 $68 $503 $289 $1,223 $2,072 $1,866 $358 $275 $98 $4,669 $2,295 $2,374 $3,597 $288 $51 $365 $300 $1,004 $1,903 $1,693 $316 $314 $96 $4,322 $2,056 $2,266 $3,270 10.3% 9.6% 8.5% 8.8% 7.4% 8.5% 2.8% 2.6% 2.6% 129.3% 125.8% 116.4% 68.7% 61.8% 55.4% 60.6% Vehicles Other (includes financial leases) Total Gross Fixed Assets (at cost) Accumulated Depreciation Net Fixed Assets Total Assets Liabilities and Stockholders' Equity Accounts Payable Notes Payable Accruals 64.0% 96.9% 61.0% 88.1% 100.0% 7% 3% 3% Total Current Liabilities 13% $ 390 $ 81 $ 140 $ 611 $ 910 $ 1,521 $ 170 $ 191 $ 428 Long-term Debt (includes financial leases) Total Liabilities 26% 10% $ 270 2% $ 99 4% $ 114 17% $ 483 28% $ 967 44% $ 1,450 5% $ 200 5% $ 191 11% $ 382 2% $ 79 4% $ 159 16% $ 620 25% $ 1,023 41% $ 1,643 5% $ 200 5% $ 191 12% $ 428 38% $ 1,135 59% $ 1,954 100% $ 3,597 39% Preferred Stock 5% Common Stock 5% 11% 27% Paid-in Capital Retained Earnings Total Stockholders' Equity Total Liabilities and Stockholders' Equity $ 1,402 $ 2,191 $ 3,712 12% $ 417 31% $ 1,012 53% $ 1,820 97% $ 3,270 49% 88% 76262 76244 76244 Common stock: # of shares outstanding Common stock: market price, end of period Book Value per share of Common Stock $ 38.20 $28.72 $ 34.02 $25.63 $ 32.10 $23.87 RATIO ANALYSIS Analysis Company 2020 2019 Industry 2018 2020 Liquidity Ratios Current Ratio 2.28 1.69 5.75 Quick (Acid-Test) Ratio Activity Ratios Inventory Turnover Average Collection Period Average Payment Period Total Asset Turnover 56.78 95.22 0.81 Fixed Asset Turnover 1.25 Debt Ratios Debt Ratio 0.39 0.64 5.67 1.64 36.1% 18.9% 11.7% $ 7.04 9.5% Debt-to-Equity Ratio Times Interest Eamed Ratio Financial Leverage (Equity) Multiplier Profitability Ratios Gross Profit Margin Operating Profit Margin Net Profit Margin Eamings per Share (EPS) Return on Total Assets (ROA) Return on Equity (ROE) Market Ratios Price/Earnings (P/E) Ratio Market/Book (M/B) Ratio Modified Dupont Analysis Net Profit Margin Total Asset Turnover Financial Leverage (Equity) Multiplier Return on Equity (ROE) 15.6% 8.82 1.38 11.7% 0.81 1.64 15.6% *Purchases percentage assumed 70% This Excel file contains the 2018-2020 Income Statement and Balance Sheet for Longview Manufacturing Corporation (LMC). Industry averages for 2020 are provided on a separate tab, along with placeholders to calculate financial revenues. a. Calculate the 2018-2020 financial ratios for LMC. b. Conduct a trends analysis for LMC. c. Compare LMC's 2020 financial ratios with the 2020 industry averages. d. Conduct a DuPont analysis e. Write up your findings. This assignment is worth 60 points


