

Answered step by step
Verified Expert Solution
Question
1 Approved Answer
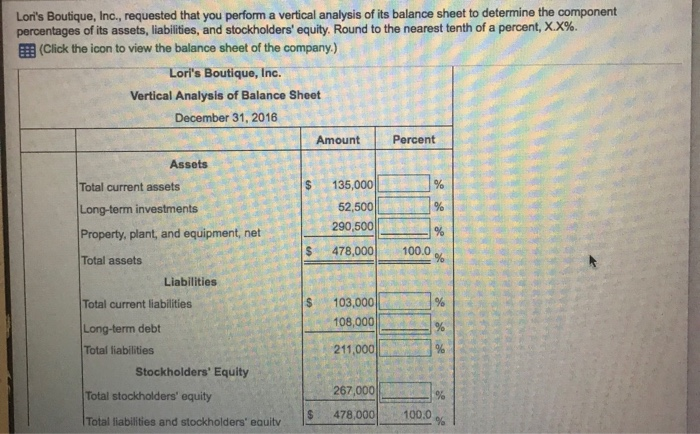
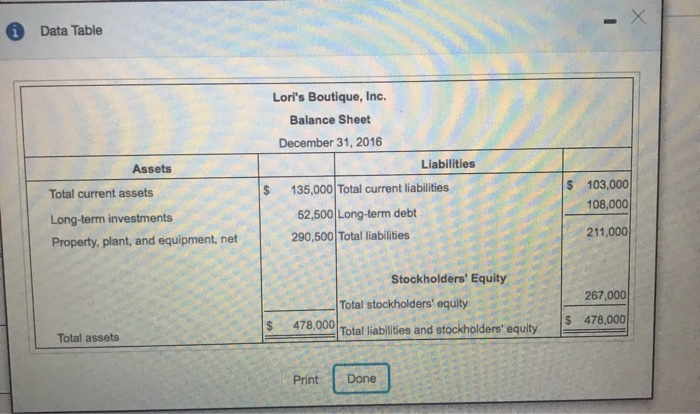
Loni's Boutique, Inc., requested that you perform a vertical analysis of its balance sheet to determine the component percentages of its assets, liabilities, and stockholders'
Step by Step Solution
There are 3 Steps involved in it
Step: 1

Get Instant Access to Expert-Tailored Solutions
See step-by-step solutions with expert insights and AI powered tools for academic success
Step: 2

Step: 3
Ace Your Homework with AI
Get the answers you need in no time with our AI-driven, step-by-step assistance
Get Started
Understanding And Conducting Information Systems Auditing
Authors: Arif Ahmed, Veena Hingarh
1st Edition
1118343743, 978-1118343746