

Answered step by step
Verified Expert Solution
Question
1 Approved Answer
Look at footnote A) What rate did Target use for its operating leases and financing leases fical year ended February 2, 2019 B). A description
Look at footnoteA) What rate did Target use for its operating leases and financing leases fical year ended February 2, 2019 B). A description of variable lease payment is required. What variable lease payment does Target have that are described in the footnote? 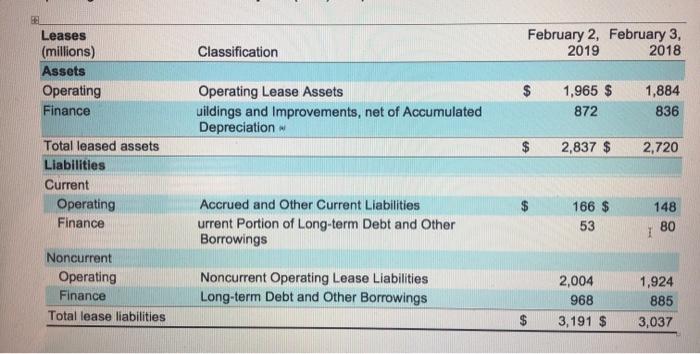
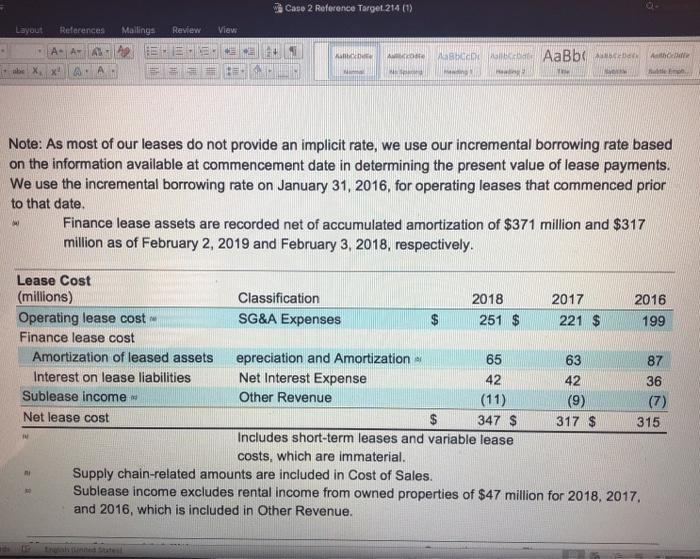
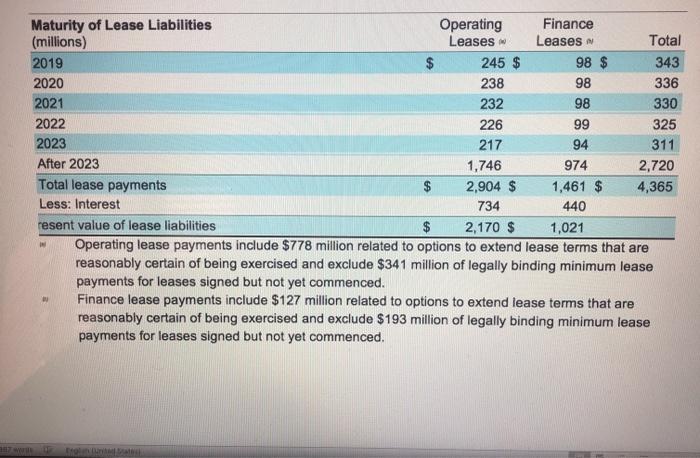
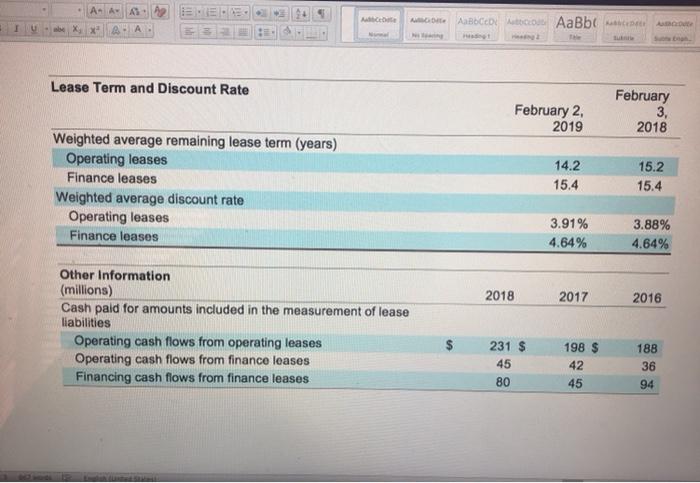 February 2, February 3, 2019 2018 Classification Leases (millions) Assets Operating Finance Operating Lease Assets uildings and improvements, net of Accumulated Depreciation 1,965 $ 872 1,884 836 2,837 $ 2,720 Total leased assets Liabilities Current Operating Finance Accrued and Other Current Liabilities urrent Portion of Long-term Debt and Other Borrowings 166 $ 53 148 80 Noncurrent Operating Finance Total lease liabilities Noncurrent Operating Lease Liabilities Long-term Debt and Other Borrowings 2,004 968 3,191 $ 1,924 885 3,037 Caso 2 Reference Target 214 (1) Layout References Mallings Review View E. AA Mac A abebi AaBbce be XX A. A Note: As most of our leases do not provide an implicit rate, we use our incremental borrowing rate based on the information available at commencement date in determining the present value of lease payments. We use the incremental borrowing rate on January 31, 2016, for operating leases that commenced prior to that date. Finance lease assets are recorded net of accumulated amortization of $371 million and $317 million as of February 2, 2019 and February 3, 2018, respectively. N Lease Cost (millions) Classification 2018 2017 2016 Operating lease cost SG&A Expenses 251 $ 221 $ 199 Finance lease cost Amortization of leased assets epreciation and Amortization 65 63 87 Interest on lease liabilities Net Interest Expense 42 42 36 Sublease income Other Revenue (11) (9) (7) Net lease cost $ 347 $ 317 $ 315 Include short-term leases and variable lease costs, which are immaterial. Supply chain-related amounts are included in Cost of Sales. Sublease income excludes rental income from owned properties of $47 million for 2018, 2017 and 2016, which is included in Other Revenue. Maturity of Lease Liabilities Operating Finance (millions) Leases Leases Total 2019 $ 245 $ 98 $ 343 2020 238 98 336 2021 232 98 330 2022 226 99 325 2023 217 94 311 After 2023 1,746 974 2,720 Total lease payments 2,904 $ 1,461 $ 4,365 Less: Interest 734 440 resent value of lease liabilities $ 2,170 $ 1,021 Operating lease payments include $778 million related to options to extend lease terms that are reasonably certain of being exercised and exclude $341 million of legally binding minimum lease payments for leases signed but not yet commenced. Finance lease payments include $127 million related to options to extend lease terms that are reasonably certain of being exercised and exclude $193 million of legally binding minimum lease payments for leases signed but not yet commenced. M A A AS MO ABODU A AaBb Lease Term and Discount Rate February 2, 2019 February 3, 2018 Weighted average remaining lease term (years) Operating leases Finance leases Weighted average discount rate Operating leases Finance leases 14.2 15.4 15.2 15.4 3.91% 4.64% 3.88% 4.64% 2018 2017 2016 Other Information (millions) Cash paid for amounts included in the measurement of lease liabilities Operating cash flows from operating leases Operating cash flows from finance leases Financing cash flows from finance leases 188 231 $ 45 80 198 $ 42 45 36 94 February 2, February 3, 2019 2018 Classification Leases (millions) Assets Operating Finance Operating Lease Assets uildings and improvements, net of Accumulated Depreciation 1,965 $ 872 1,884 836 2,837 $ 2,720 Total leased assets Liabilities Current Operating Finance Accrued and Other Current Liabilities urrent Portion of Long-term Debt and Other Borrowings 166 $ 53 148 80 Noncurrent Operating Finance Total lease liabilities Noncurrent Operating Lease Liabilities Long-term Debt and Other Borrowings 2,004 968 3,191 $ 1,924 885 3,037 Caso 2 Reference Target 214 (1) Layout References Mallings Review View E. AA Mac A abebi AaBbce be XX A. A Note: As most of our leases do not provide an implicit rate, we use our incremental borrowing rate based on the information available at commencement date in determining the present value of lease payments. We use the incremental borrowing rate on January 31, 2016, for operating leases that commenced prior to that date. Finance lease assets are recorded net of accumulated amortization of $371 million and $317 million as of February 2, 2019 and February 3, 2018, respectively. N Lease Cost (millions) Classification 2018 2017 2016 Operating lease cost SG&A Expenses 251 $ 221 $ 199 Finance lease cost Amortization of leased assets epreciation and Amortization 65 63 87 Interest on lease liabilities Net Interest Expense 42 42 36 Sublease income Other Revenue (11) (9) (7) Net lease cost $ 347 $ 317 $ 315 Include short-term leases and variable lease costs, which are immaterial. Supply chain-related amounts are included in Cost of Sales. Sublease income excludes rental income from owned properties of $47 million for 2018, 2017 and 2016, which is included in Other Revenue. Maturity of Lease Liabilities Operating Finance (millions) Leases Leases Total 2019 $ 245 $ 98 $ 343 2020 238 98 336 2021 232 98 330 2022 226 99 325 2023 217 94 311 After 2023 1,746 974 2,720 Total lease payments 2,904 $ 1,461 $ 4,365 Less: Interest 734 440 resent value of lease liabilities $ 2,170 $ 1,021 Operating lease payments include $778 million related to options to extend lease terms that are reasonably certain of being exercised and exclude $341 million of legally binding minimum lease payments for leases signed but not yet commenced. Finance lease payments include $127 million related to options to extend lease terms that are reasonably certain of being exercised and exclude $193 million of legally binding minimum lease payments for leases signed but not yet commenced. M A A AS MO ABODU A AaBb Lease Term and Discount Rate February 2, 2019 February 3, 2018 Weighted average remaining lease term (years) Operating leases Finance leases Weighted average discount rate Operating leases Finance leases 14.2 15.4 15.2 15.4 3.91% 4.64% 3.88% 4.64% 2018 2017 2016 Other Information (millions) Cash paid for amounts included in the measurement of lease liabilities Operating cash flows from operating leases Operating cash flows from finance leases Financing cash flows from finance leases 188 231 $ 45 80 198 $ 42 45 36 94
A) What rate did Target use for its operating leases and financing leases fical year ended February 2, 2019
B). A description of variable lease payment is required. What variable lease payment does Target have that are described in the footnote?
Step by Step Solution
There are 3 Steps involved in it
Step: 1

Get Instant Access to Expert-Tailored Solutions
See step-by-step solutions with expert insights and AI powered tools for academic success
Step: 2

Step: 3
Ace Your Homework with AI
Get the answers you need in no time with our AI-driven, step-by-step assistance
Get Started
Managerial Accounting Tools For Business Decision Making Wileyplus Lms Student Package
Authors: Jerry J. Weygandt, Paul D. Kimmel, Donald E. Kieso
8th Edition
1119390249, 978-1119390244