Look at the chart on page 404 in Mankiw.Compare U.S. income inequality to at least 2 other high income countries countries on the chart and 2 low income countries on the chart.Mankiw indicates there are problems measuring income inequality on page 407.What are they and what are other measures of income inequality?Use the data in chart to support your comparisons.
page 404 is the one with the blue chart.
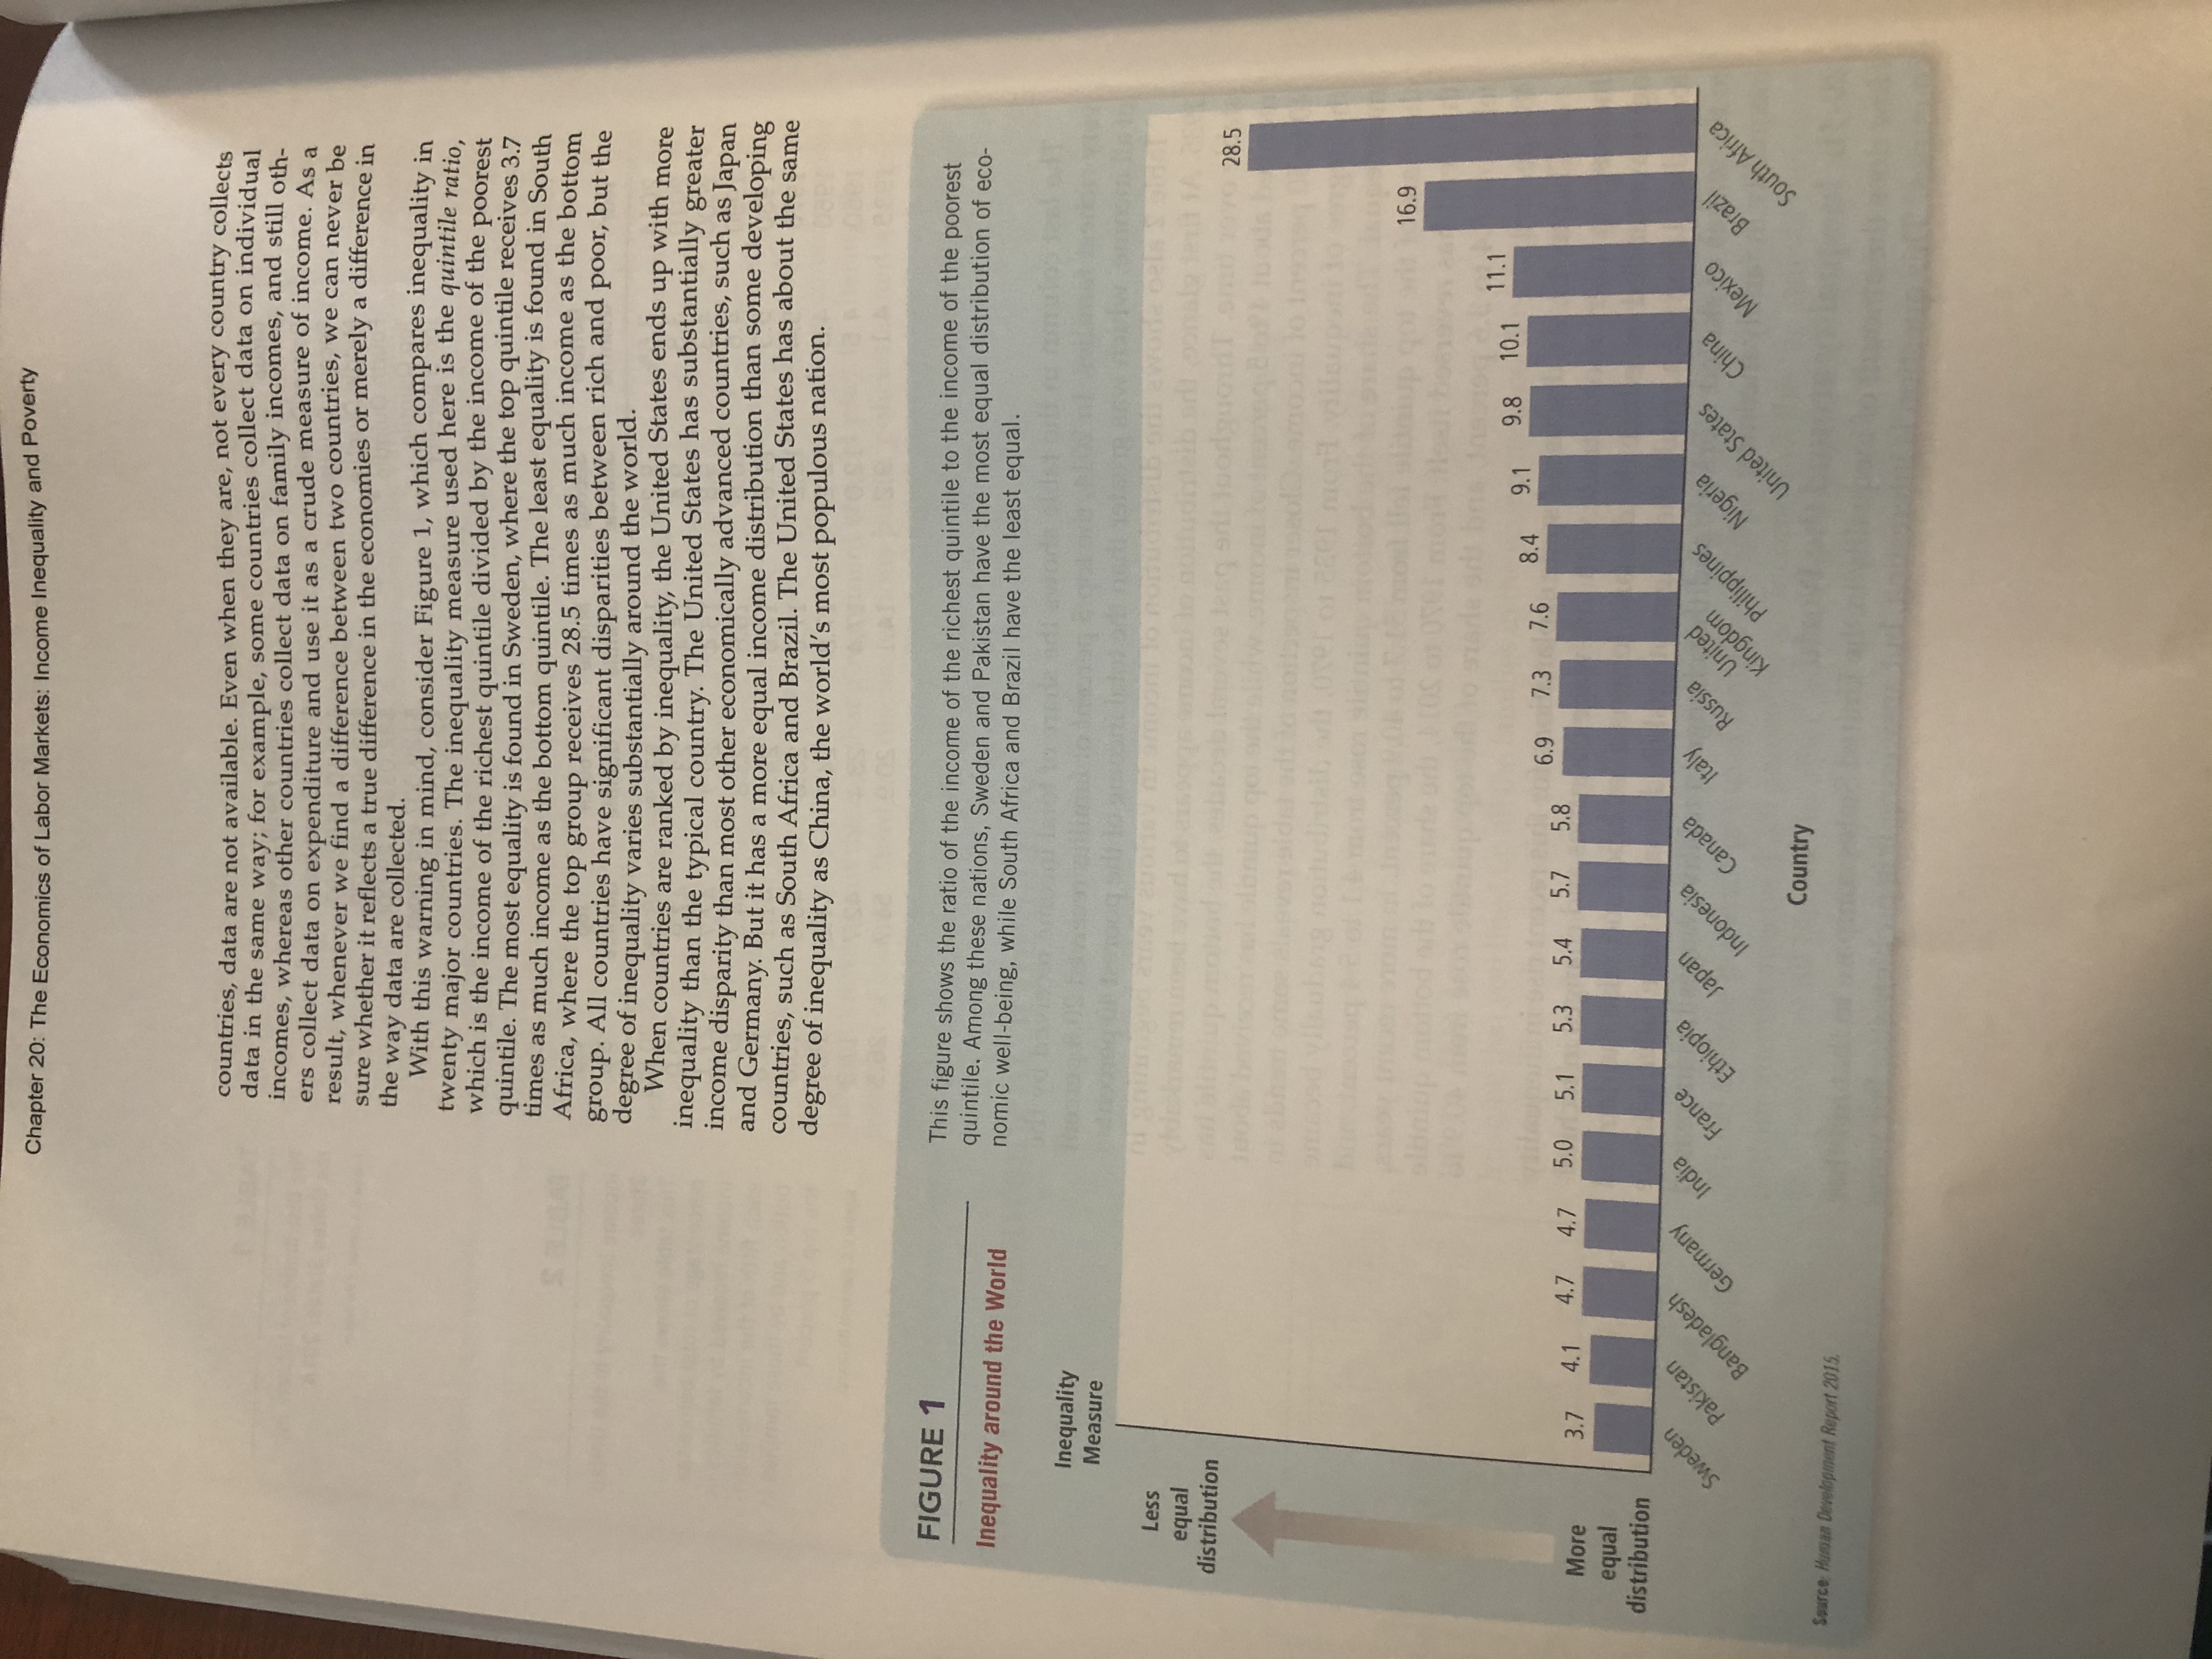
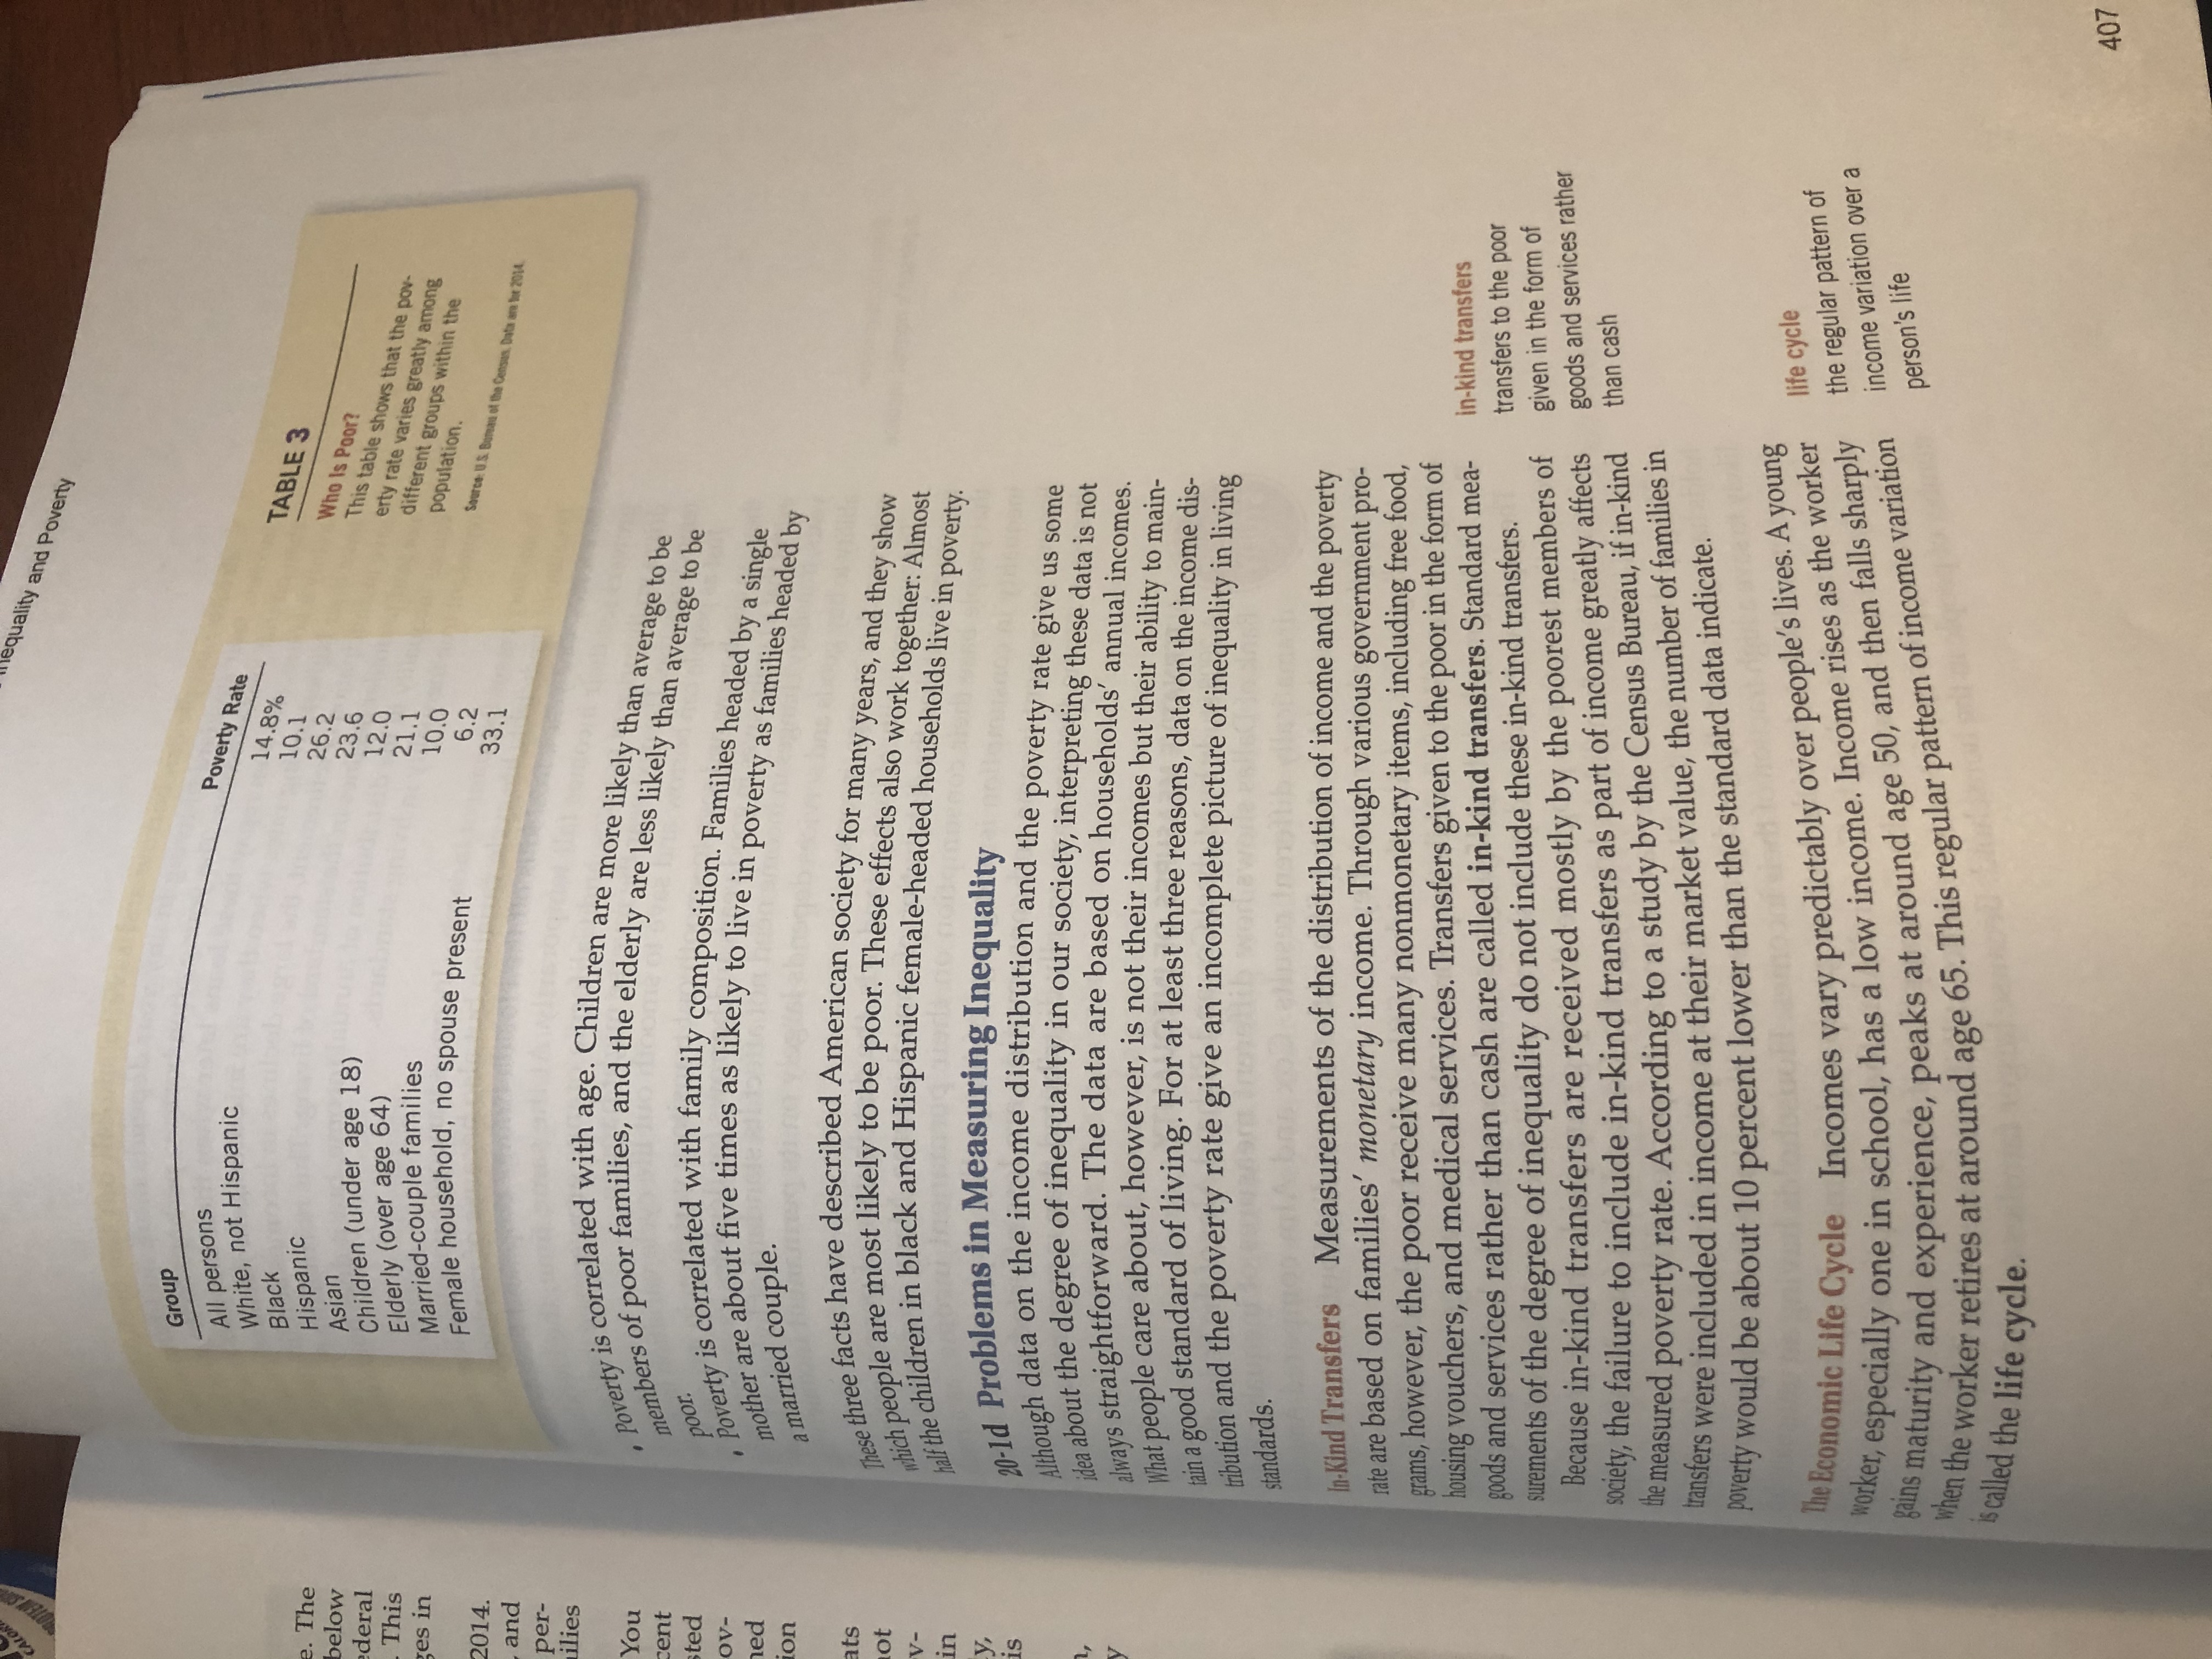
Chapter 20: The Economics of Labor Markets: Income Inequality and Poverty countries, data are not available. Even when they are, not every country collects data in the same way; for example, some countries collect data on individual incomes, whereas other countries collect data on family incomes, and still oth- ers collect data on expenditure and use it as a crude measure of income. As a result, whenever we find a difference between two countries, we can never be sure whether it reflects a true difference in the economies or merely a difference in the way data are collected. With this warning in mind, consider Figure 1, which compares inequality in twenty major countries. The inequality measure used here is the quintile ratio, which is the income of the richest quintile divided by the income of the poorest quintile. The most equality is found in Sweden, where the top quintile receives 3.7 times as much income as the bottom quintile. The least equality is found in South Africa, where the top group receives 28.5 times as much income as the bottom group. All countries have significant disparities between rich and poor, but the degree of inequality varies substantially around the world. When countries are ranked by inequality, the United States ends up with more inequality than the typical country. The United States has substantially greater income disparity than most other economically advanced countries, such as Japan and Germany. But it has a more equal income distribution than some developing countries, such as South Africa and Brazil. The United States has about the same degree of inequality as China, the world's most populous nation. FIGURE 1 This figure shows the ratio of the income of the richest quintile to the income of the poorest Inequality around the World quintile. Among these nations, Sweden and Pakistan have the most equal distribution of eco- nomic well-being, while South Africa and Brazil have the least equal. Inequality Measure Less equal distribution 28.5 ous Loubing noil slidalop moffod andd to 16.9 8.4 9.1 9.8 10.1 11.1 5.7 6.9 7.3 7.6 More 3.7 4.1 4.7 4.7 5.0 5.1 5.3 5.4 5.8 equal distribution Sweden Pakistan Bangladesh Germany India France Ethiopia Japan Indonesia nada Italy Russia United kingdom Philippines Nigeria United States China Mexico Brazi South Africa Country Source: Human Development Report 2015.equality and Poverty Group All persons White, not Hispanic Poverty Rate Black 14.8% e. The Hispanic 10.1 TABLE 3 below deral Asian 26.2 Children (under age 18) 23.6 Who Is Poor? This Elderly (over age 64) 12.0 Married-couple families This table shows that the pov- yes in 10.0 erty rate varies greatly among Female household, no spouse present different groups within the 6.2 population. 2014 and 33.1 Source: U S. Bureau of the Census, Data are for 2014. per- ilies You cent Poverty is correlated with age. Children are more likely than average to be ted poor . members of poor families, and the elderly are less likely than average to be ov- led . Poverty is correlated with family composition. Families headed by a single ion mother are about five times as likely to live in poverty as families headed by a married couple. ats lot These three facts have described American society for many years, and they show which people are most likely to be poor. These effects also work together: Almost half the children in black and Hispanic female-headed households live in poverty. 20-1d Problems in Measuring Inequality Although data on the income distribution and the poverty rate give us some idea about the degree of inequality in our society, interpreting these data is not always straightforward. The data are based on households' annual incomes. What people care about, however, is not their incomes but their ability to main- tain a good standard of living. For at least three reasons, data on the income dis- standards. tribution and the poverty rate give an incomplete picture of inequality in living In-Kind Transfers Measurements of the distribution of income and the poverty rate are based on families' monetary income. Through various government pro- grams, however, the poor receive many nonmonetary items, including free food, housing vouchers, and medical services. Transfers given to the poor in the form of goods and services rather than cash are called in-kind transfers. Standard mea- in-kind transfers surements of the degree of inequality do not include these in-kind transfers. transfers to the poor Because in-kind transfers are received mostly by the poorest members of given in the form of society, the failure to include in-kind transfers as part of income greatly affects goods and services rather the measured poverty rate. According to a study by the Census Bureau, if in-kind than cash transfers were included in income at their market value, the number of families in poverty would be about 10 percent lower than the standard data indicate. The Economic Life Cycle Incomes vary predictably over people's lives. A young worker, especially one in school, has a low income. Income rises as the worker life cycle the regular pattern of gains maturity and experience, peaks at around age 50, and then falls sharply income variation over a when the worker retires at around age 65. This regular pattern of income variation person's life is called the life cycle. 407