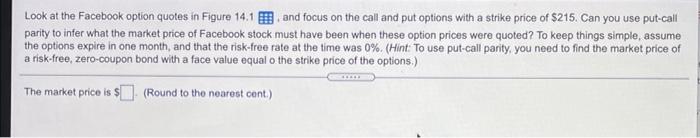
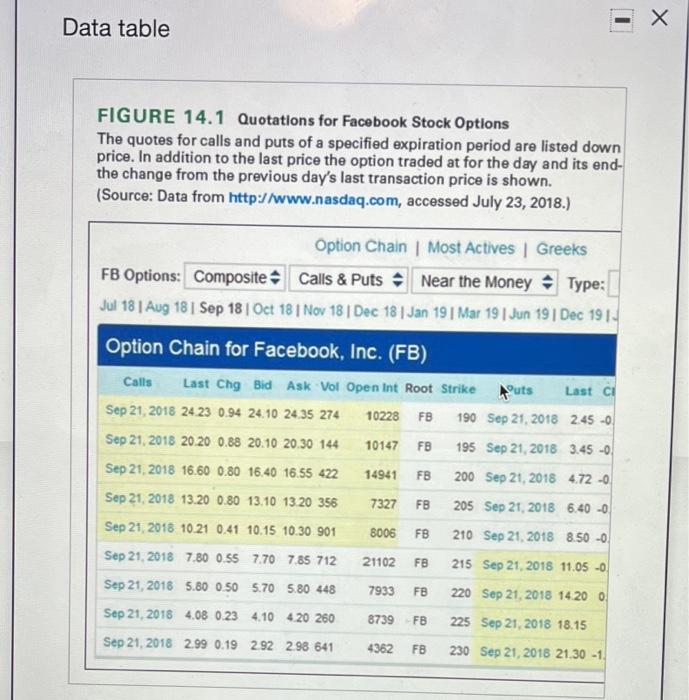
Look at the Facebook option quotes in Figure 14.1 and focus on the call and put options with a strike price of $215. Can you use put-call parity to infer what the market price of Facebook stock must have been when these option prices were quoted? To keep things simple, assume the options expire in one month, and that the risk-free rate at the time was 0%. (Hint: To use put-call parity, you need to find the market price of a risk-free, zero-coupon bond with a face value equal o the strike price of the options.) The market price is $(Round to the nearest cent) Data table FIGURE 14.1 Quotations for Facebook Stock Options The quotes for calls and puts of a specified expiration period are listed down price. In addition to the last price the option traded at for the day and its end- the change from the previous day's last transaction price is shown. (Source: Data from http://www.nasdaq.com, accessed July 23, 2018.) Option Chain Most Actives Greeks FB Options: Composite Calls & Puts - Near the Money Type: Jul 18 Aug 18 Sep 18 Oct 18 Nov 18 Dec 18 Jan 19 Mar 19 Jun 19 Dec 1914 Option Chain for Facebook, Inc. (FB) Calls Last Chg Bid Ask Vol Open Int Root Strike Puts Last ci Sep 21, 2018 24.23 0.94 24.10 24.35 274 10228 FB 190 Sep 21, 2018 2.45 -0. Sep 21, 2018 20.20 0.88 20.10 20.30 144 10147 FB 195 Sep 21, 2018 3.45 -0 Sep 21, 2018 16.60 0.80 16.40 16.55 422 14941 FB 200 Sep 21, 2018 4.72-0 Sep 21, 2018 13.20 0.80 13.10 13.20 356 7327 FB 205 Sep 21, 2018 6.40 -0 Sep 21, 2018 10.21 0.41 10.15 10.30.901 8006 FB 210 Sep 21, 2018 8.50 -0 Sep 21, 2018 7.80 0.55 7.70785 712 21102 FB 215 Sep 21, 2018 11.05 -0 Sep 21, 2016 5.80 0.50 5.70 5.80 448 7933 FB 220 Sep 21, 2018 14 20 0 Sep 21, 2018 4.08 0.23 4.10 4.20 260 8739 FB 225 Sep 21, 2018 18.15 Sep 21, 2018 2.99 0.19 292 298 641 4362 FB 230 Sep 21, 2018 21.30 -1