Look at the financial statement note disclosure for Receivables, Long Lived Assets; Liabilities; and Stockholders equity. Read the note disclosure and comment on the information listed in the disclosure.
Please help me with this project. Please write a report and evaluate the disclosure .Thank you very much.I really appreciate.If you need more information please let me know.
Receivable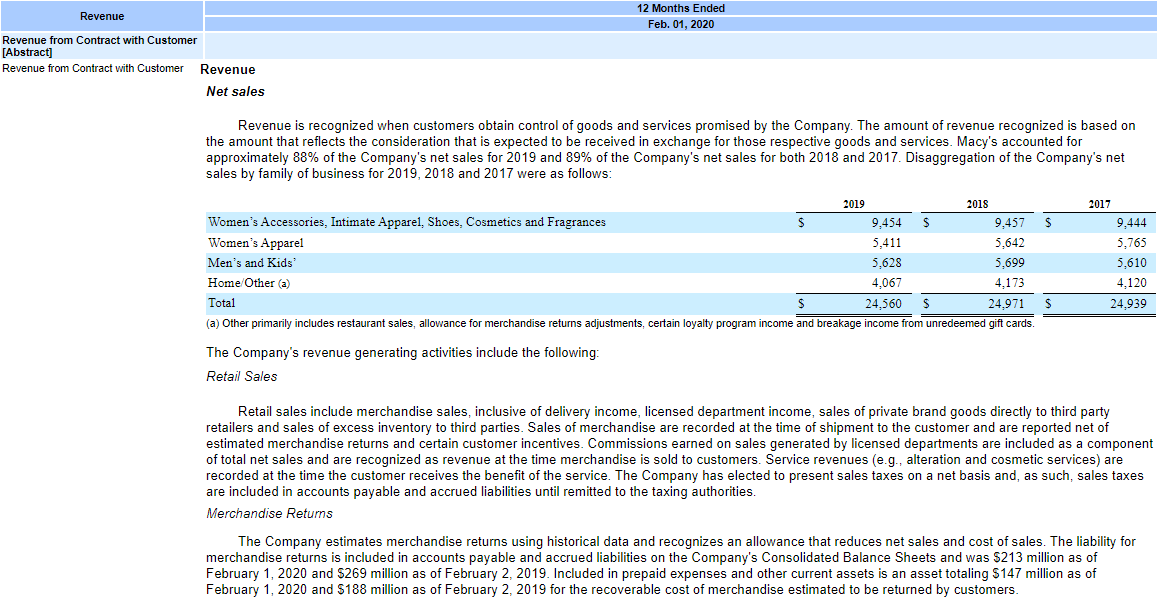
Long Lived Asset
Liability
Stockholder equity
Basically it to evaluate note disclosure about asset liability and stockholder equity use the given data.Compare each Year How the ratio change affect company performance.
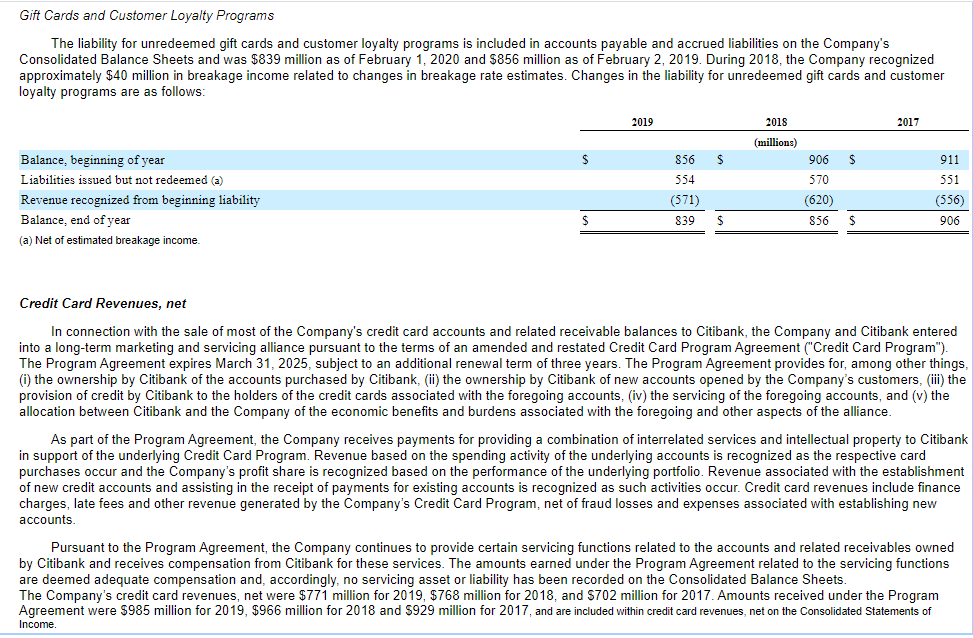
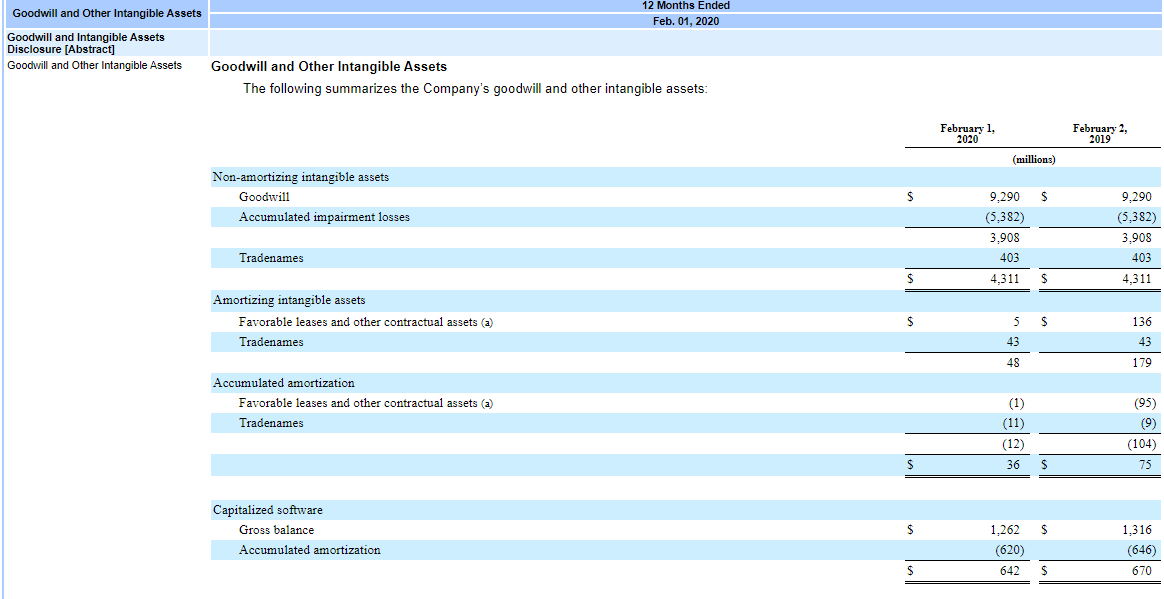
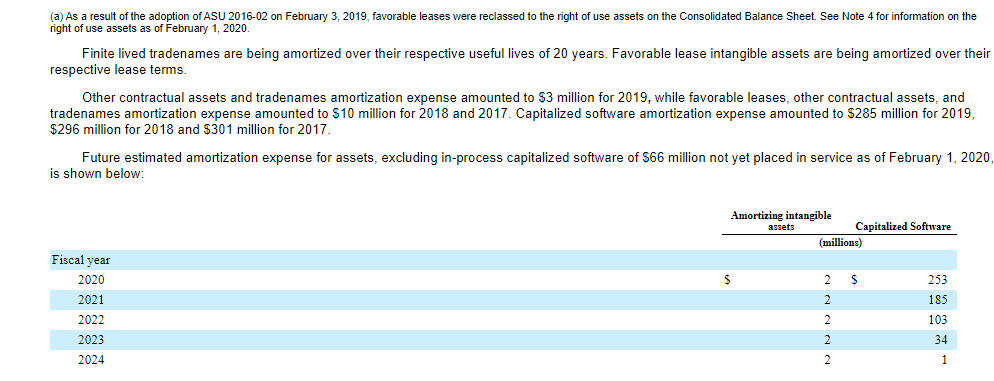
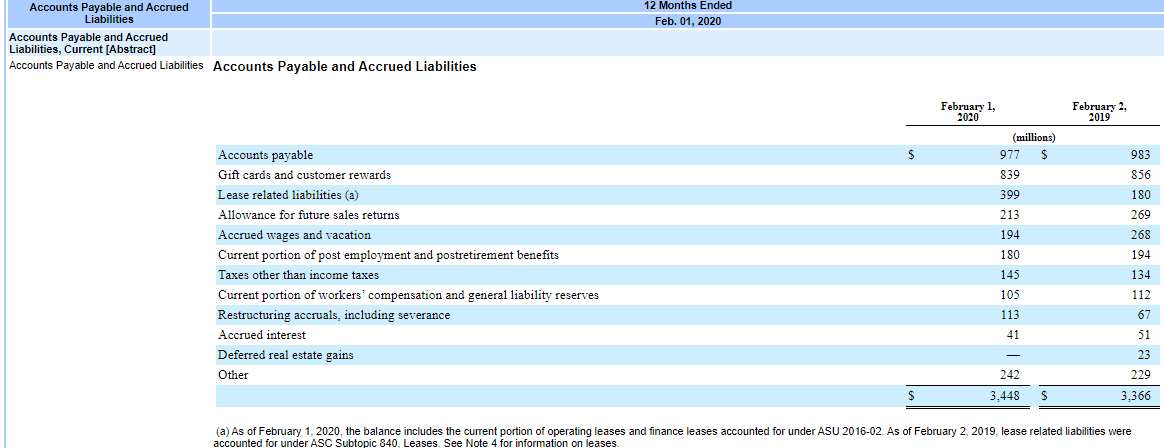
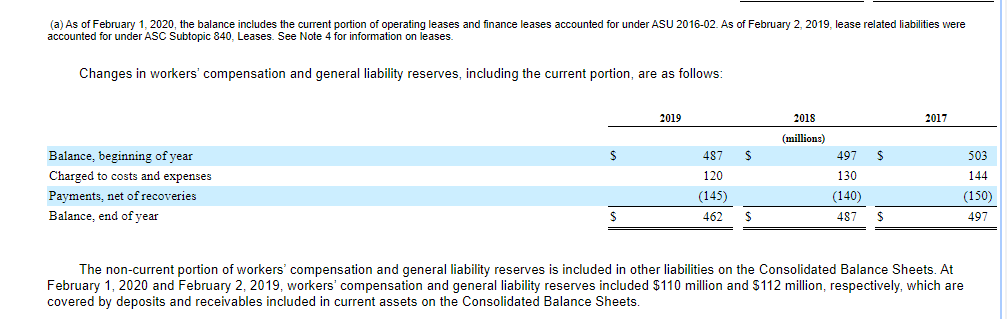
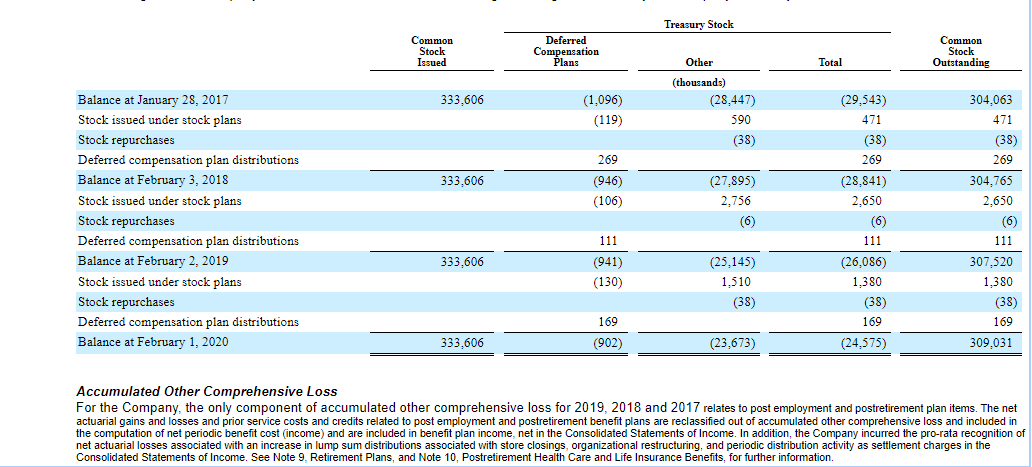
Revenue 12 Months Ended Feb. 01, 2020 Revenue from Contract with Customer [Abstract] Revenue from Contract with Customer Revenue Net sales Revenue is recognized when customers obtain control of goods and services promised by the Company. The amount of revenue recognized is based on the amount that reflects the consideration that is expected to be received in exchange for those respective goods and services. Macy's accounted for approximately 88% of the Company's net sales for 2019 and 89% of the Company's net sales for both 2018 and 2017. Disaggregation of the Company's net sales by family of business for 2019, 2018 and 2017 were as follows: $ 2019 2015 Women's Accessories, Intimate Apparel, Shoes, Cosmetics and Fragrances $ 9.454 $ 9,457 Women's Apparel 5,411 5,642 Men's and Kids' 5.628 5,699 Home Other (a) 4,067 4.173 Total 24,560 $ 24.971 (a) Other primarily includes restaurant sales, allowance for merchandise returns adjustments, certain loyalty program income and breakage income from unredeemed gift cards. The Company's revenue generating activities include the following: Retail Sales 2017 9,444 5,765 5,610 4,120 24.939 Retail sales include merchandise sales, inclusive of delivery income, licensed department income, sales of private brand goods directly to third party retailers and sales of excess inventory to third parties. Sales of merchandise are recorded at the time of shipment to the customer and are reported net of estimated merchandise returns and certain customer incentives. Commissions earned on sales generated by licensed departments are included as a component of total net sales and are recognized as revenue at the time merchandise is sold to customers. Service revenues (e.g., alteration and cosmetic services) are recorded at the time the customer receives the benefit of the service. The Company has elected to present sales taxes on a net basis and, as such, sales taxes are included in accounts payable and accrued liabilities until remitted to the taxing authorities. Merchandise Returns The Company estimates merchandise returns using historical data and recognizes an allowance that reduces net sales and cost of sales. The liability for merchandise returns is included in accounts payable and accrued liabilities on the Company's Consolidated Balance Sheets and was $213 million as of February 1, 2020 and $269 million as of February 2, 2019. Included in prepaid expenses and other current assets is an asset totaling $147 million as of February 1, 2020 and $188 million as of February 2, 2019 for the recoverable cost merchandise estimated to be returned by customers Gift Cards and Customer Loyalty Programs The liability for unredeemed gift cards and customer loyalty programs is included in accounts payable and accrued liabilities on the Company's Consolidated Balance Sheets and was $839 million as of February 1, 2020 and $856 million as of February 2, 2019. During 2018, the Company recognized approximately $40 million in breakage income related to changes in breakage rate estimates. Changes in the liability for unredeemed gift cards and customer loyalty programs are as follows: 2019 2018 2017 (millions) $ $ 911 551 Balance, beginning of year Liabilities issued but not redeemed (a) Revenue recognized from beginning liability Balance, end of year (a) Net of estimated breakage income. 856 554 (571) 839 906 570 (620) 856 (556) $ $ 906 Credit Card Revenues, net In connection with the sale of most of the Company's credit card accounts and related receivable balances to Citibank, the Company and Citibank entered into a long-term marketing and servicing alliance pursuant to the terms of an amended and restated Credit Card Program Agreement ("Credit Card Program"). The Program Agreement expires March 31, 2025, subject to an additional renewal term of three years. The Program Agreement provides for, among other things, (i) the ownership by Citibank of the accounts purchased by Citibank, (ii) the ownership by Citibank of new accounts opened by the Company's customers, (iii) the provision of credit by Citibank to the holders of the credit cards associated with the foregoing accounts, (iv) the servicing of the foregoing accounts, and (v) the allocation between Citibank and the Company of the economic benefits and burdens associated with the foregoing and other aspects of the alliance. As part of the Program Agreement, the Company receives payments for providing a combination of interrelated services and intellectual property to Citibank in support of the underlying Credit Card Program. Revenue based on the spending activity of the underlying accounts is recognized as the respective card purchases occur and the Company's profit share is recognized based on the performance of the underlying portfolio. Revenue associated with the establishment of new credit accounts and assisting in the receipt of payments for existing accounts is recognized as such activities occur. Credit card revenues include finance charges, late fees and other revenue generated by the Company's Credit Card Program, net of fraud losses and expenses associated with establishing new accounts. Pursuant to the Program Agreement, the Company continues to provide certain servicing functions related to the accounts and related receivables owned by Citibank and receives compensation from Citibank for these services. The amounts earned under the Program Agreement related to the servicing functions are deemed adequate compensation and, accordingly, no servicing asset or liability has been recorded on the Consolidated Balance Sheets. The Company's credit card revenues, net were $771 million for 2019, $768 million for 2018, and $702 million for 2017 Amounts received under the Program Agreement were $985 million for 2019, $966 million for 2018 and $929 million for 2017, and are included within credit card revenues, net on the Consolidated Statements of Income. Goodwill and Other Intangible Assets 12 Months Ended Feb. 01, 2020 Goodwill and Intangible Assets Disclosure [Abstract] Goodwill and Other Intangible Assets Goodwill and Other Intangible Assets The following summarizes the Company's goodwill and other intangible assets: February 1, 2020 February 2, 2019 (millions) Non-amortizing intangible assets Goodwill Accumulated impairment losses S $ 9.290 (5.382) 3,908 403 9,290 (5.382) 3.908 403 4,311 Tradenames $ 4.311 Amortizing intangible assets Favorable leases and other contractual assets (a) Tradenames $ 5 $ 136 43 43 48 179 Accumulated amortization Favorable leases and other contractual assets (a) Tradenames (1) (11) (12) (95) (9) (104) $ 36 75 Capitalized software Gross balance Accumulated amortization $ $ 1,262 (620) 642 1,316 (646) 670 $ $ (a) As a result of the adoption of ASU 2016-02 on February 3, 2019, favorable leases were reclassed to the right of use assets on the Consolidated Balance Sheet. See Note 4 for information on the right of use assets as of February 1, 2020 Finite lived tradenames are being amortized over their respective useful lives of 20 years. Favorable lease intangible assets are being amortized over their respective lease terms. Other contractual assets and tradenames amortization expense amounted to $3 million for 2019, while favorable leases, other contractual assets, and tradenames amortization expense amounted to $10 million for 2018 and 2017. Capitalized software amortization expense amounted to $285 million for 2019, $296 million for 2018 and $301 million for 2017 Future estimated amortization expense for assets, excluding in-process capitalized software of $66 million not yet placed in service as of February 1, 2020, is shown below: Amortizing intangible assets Capitalized Software (millions) $ 2 $ N Fiscal year 2020 2021 2022 2023 2024 253 185 103 34 2 1 12 Months Ended Feb. 01, 2020 Accounts Payable and Accrued Liabilities Accounts Payable and Accrued Liabilities, Current [Abstract] Accounts Payable and Accrued Liabilities Accounts Payable and Accrued Liabilities February 1, 2020 February 2, 2019 (millions) 977 $ $ 983 856 Accounts payable Gift cards and customer rewards Lease related liabilities (a) Allowance for future sales returns Accrued wages and vacation Current portion of post employment and postretirement benefits Taxes other than income taxes Current portion of workers' compensation and general liability reserves Restructuring accruals, including severance Accrued interest Deferred real estate gains Other 839 399 213 194 180 145 180 269 268 194 134 105 113 112 67 51 41 23 229 242 3,448 $ $ 3,366 (a) As of February 1, 2020, the balance includes the current portion of operating leases and finance leases accounted for under ASU 2016-02. As of February 2, 2019, lease related liabilities were accounted for under ASC Subtopic 840. Leases. See Note 4 for information on leases (a) As of February 1, 2020, the balance includes the current portion of operating leases and finance leases accounted for under ASU 2016-02. As of February 2, 2019, lease related liabilities were accounted for under ASC Subtopic 840, Leases. See Note 4 for information on leases. Changes in workers' compensation and general liability reserves, including the current portion, are as follows: 2019 2015 2017 (millions) $ 487 $ 120 Balance, beginning of year Charged to costs and expenses Payments, net of recoveries Balance, end of year 497 130 (140) 503 144 (150) 497 (145) 462 487 The non-current portion of workers' compensation and general liability reserves is included in other liabilities on the Consolidated Balance Sheets. At February 1, 2020 and February 2, 2019, workers' compensation and general liability reserves included $110 million and $112 million, respectively, which are covered by deposits and receivables included in current assets on the Consolidated Balance Sheets. Treasury Stock Common Stock Issued Deferred Compensation Plans Common Stock Outstanding Other Total 333,606 (1,096) (119) (thousands) (28,447) 590 (38) 269 333,606 (946) (106) Balance at January 28, 2017 Stock issued under stock plans Stock repurchases Deferred compensation plan distributions Balance at February 3, 2018 Stock issued under stock plans Stock repurchases Deferred compensation plan distributions Balance at February 2, 2019 Stock issued under stock plans Stock repurchases Deferred compensation plan distributions Balance at February 1, 2020 (27,895) 2.756 (6) (29,543) 471 (38) 269 (28,841) 2,650 (6) 111 (26,086) 1,380 (38) 169 (24,575) 304,063 471 (38) 269 304,765 2,650 (6) 111 307,520 1,380 (38) 169 309,031 333,606 111 (941) (130) (25,145) 1,510 (38) 169 333,606 (902) (23,673) Accumulated Other Comprehensive Loss For the Company, the only component of accumulated other comprehensive loss for 2019, 2018 and 2017 relates to post employment and postretirement plan items. The net actuarial gains and losses and prior service costs and credits related to post employment and postretirement benefit plans are reclassified out of accumulated other comprehensive loss and included in the computation of net periodic benefit cost (income) and are included in benefit plan income, net in the Consolidated Statements of Income. In addition, the Company incurred the pro-rata recognition of net actuarial losses associated with an increase in lump sum distributions associated with store closings, organizational restructuring, and periodic distribution activity as settlement charges in the Consolidated Statements of Income. See Note 9. Retirement Plans, and Note 10, Postretirement Health Care and Life Insurance Benefits, for further information. Revenue 12 Months Ended Feb. 01, 2020 Revenue from Contract with Customer [Abstract] Revenue from Contract with Customer Revenue Net sales Revenue is recognized when customers obtain control of goods and services promised by the Company. The amount of revenue recognized is based on the amount that reflects the consideration that is expected to be received in exchange for those respective goods and services. Macy's accounted for approximately 88% of the Company's net sales for 2019 and 89% of the Company's net sales for both 2018 and 2017. Disaggregation of the Company's net sales by family of business for 2019, 2018 and 2017 were as follows: $ 2019 2015 Women's Accessories, Intimate Apparel, Shoes, Cosmetics and Fragrances $ 9.454 $ 9,457 Women's Apparel 5,411 5,642 Men's and Kids' 5.628 5,699 Home Other (a) 4,067 4.173 Total 24,560 $ 24.971 (a) Other primarily includes restaurant sales, allowance for merchandise returns adjustments, certain loyalty program income and breakage income from unredeemed gift cards. The Company's revenue generating activities include the following: Retail Sales 2017 9,444 5,765 5,610 4,120 24.939 Retail sales include merchandise sales, inclusive of delivery income, licensed department income, sales of private brand goods directly to third party retailers and sales of excess inventory to third parties. Sales of merchandise are recorded at the time of shipment to the customer and are reported net of estimated merchandise returns and certain customer incentives. Commissions earned on sales generated by licensed departments are included as a component of total net sales and are recognized as revenue at the time merchandise is sold to customers. Service revenues (e.g., alteration and cosmetic services) are recorded at the time the customer receives the benefit of the service. The Company has elected to present sales taxes on a net basis and, as such, sales taxes are included in accounts payable and accrued liabilities until remitted to the taxing authorities. Merchandise Returns The Company estimates merchandise returns using historical data and recognizes an allowance that reduces net sales and cost of sales. The liability for merchandise returns is included in accounts payable and accrued liabilities on the Company's Consolidated Balance Sheets and was $213 million as of February 1, 2020 and $269 million as of February 2, 2019. Included in prepaid expenses and other current assets is an asset totaling $147 million as of February 1, 2020 and $188 million as of February 2, 2019 for the recoverable cost merchandise estimated to be returned by customers Gift Cards and Customer Loyalty Programs The liability for unredeemed gift cards and customer loyalty programs is included in accounts payable and accrued liabilities on the Company's Consolidated Balance Sheets and was $839 million as of February 1, 2020 and $856 million as of February 2, 2019. During 2018, the Company recognized approximately $40 million in breakage income related to changes in breakage rate estimates. Changes in the liability for unredeemed gift cards and customer loyalty programs are as follows: 2019 2018 2017 (millions) $ $ 911 551 Balance, beginning of year Liabilities issued but not redeemed (a) Revenue recognized from beginning liability Balance, end of year (a) Net of estimated breakage income. 856 554 (571) 839 906 570 (620) 856 (556) $ $ 906 Credit Card Revenues, net In connection with the sale of most of the Company's credit card accounts and related receivable balances to Citibank, the Company and Citibank entered into a long-term marketing and servicing alliance pursuant to the terms of an amended and restated Credit Card Program Agreement ("Credit Card Program"). The Program Agreement expires March 31, 2025, subject to an additional renewal term of three years. The Program Agreement provides for, among other things, (i) the ownership by Citibank of the accounts purchased by Citibank, (ii) the ownership by Citibank of new accounts opened by the Company's customers, (iii) the provision of credit by Citibank to the holders of the credit cards associated with the foregoing accounts, (iv) the servicing of the foregoing accounts, and (v) the allocation between Citibank and the Company of the economic benefits and burdens associated with the foregoing and other aspects of the alliance. As part of the Program Agreement, the Company receives payments for providing a combination of interrelated services and intellectual property to Citibank in support of the underlying Credit Card Program. Revenue based on the spending activity of the underlying accounts is recognized as the respective card purchases occur and the Company's profit share is recognized based on the performance of the underlying portfolio. Revenue associated with the establishment of new credit accounts and assisting in the receipt of payments for existing accounts is recognized as such activities occur. Credit card revenues include finance charges, late fees and other revenue generated by the Company's Credit Card Program, net of fraud losses and expenses associated with establishing new accounts. Pursuant to the Program Agreement, the Company continues to provide certain servicing functions related to the accounts and related receivables owned by Citibank and receives compensation from Citibank for these services. The amounts earned under the Program Agreement related to the servicing functions are deemed adequate compensation and, accordingly, no servicing asset or liability has been recorded on the Consolidated Balance Sheets. The Company's credit card revenues, net were $771 million for 2019, $768 million for 2018, and $702 million for 2017 Amounts received under the Program Agreement were $985 million for 2019, $966 million for 2018 and $929 million for 2017, and are included within credit card revenues, net on the Consolidated Statements of Income. Goodwill and Other Intangible Assets 12 Months Ended Feb. 01, 2020 Goodwill and Intangible Assets Disclosure [Abstract] Goodwill and Other Intangible Assets Goodwill and Other Intangible Assets The following summarizes the Company's goodwill and other intangible assets: February 1, 2020 February 2, 2019 (millions) Non-amortizing intangible assets Goodwill Accumulated impairment losses S $ 9.290 (5.382) 3,908 403 9,290 (5.382) 3.908 403 4,311 Tradenames $ 4.311 Amortizing intangible assets Favorable leases and other contractual assets (a) Tradenames $ 5 $ 136 43 43 48 179 Accumulated amortization Favorable leases and other contractual assets (a) Tradenames (1) (11) (12) (95) (9) (104) $ 36 75 Capitalized software Gross balance Accumulated amortization $ $ 1,262 (620) 642 1,316 (646) 670 $ $ (a) As a result of the adoption of ASU 2016-02 on February 3, 2019, favorable leases were reclassed to the right of use assets on the Consolidated Balance Sheet. See Note 4 for information on the right of use assets as of February 1, 2020 Finite lived tradenames are being amortized over their respective useful lives of 20 years. Favorable lease intangible assets are being amortized over their respective lease terms. Other contractual assets and tradenames amortization expense amounted to $3 million for 2019, while favorable leases, other contractual assets, and tradenames amortization expense amounted to $10 million for 2018 and 2017. Capitalized software amortization expense amounted to $285 million for 2019, $296 million for 2018 and $301 million for 2017 Future estimated amortization expense for assets, excluding in-process capitalized software of $66 million not yet placed in service as of February 1, 2020, is shown below: Amortizing intangible assets Capitalized Software (millions) $ 2 $ N Fiscal year 2020 2021 2022 2023 2024 253 185 103 34 2 1 12 Months Ended Feb. 01, 2020 Accounts Payable and Accrued Liabilities Accounts Payable and Accrued Liabilities, Current [Abstract] Accounts Payable and Accrued Liabilities Accounts Payable and Accrued Liabilities February 1, 2020 February 2, 2019 (millions) 977 $ $ 983 856 Accounts payable Gift cards and customer rewards Lease related liabilities (a) Allowance for future sales returns Accrued wages and vacation Current portion of post employment and postretirement benefits Taxes other than income taxes Current portion of workers' compensation and general liability reserves Restructuring accruals, including severance Accrued interest Deferred real estate gains Other 839 399 213 194 180 145 180 269 268 194 134 105 113 112 67 51 41 23 229 242 3,448 $ $ 3,366 (a) As of February 1, 2020, the balance includes the current portion of operating leases and finance leases accounted for under ASU 2016-02. As of February 2, 2019, lease related liabilities were accounted for under ASC Subtopic 840. Leases. See Note 4 for information on leases (a) As of February 1, 2020, the balance includes the current portion of operating leases and finance leases accounted for under ASU 2016-02. As of February 2, 2019, lease related liabilities were accounted for under ASC Subtopic 840, Leases. See Note 4 for information on leases. Changes in workers' compensation and general liability reserves, including the current portion, are as follows: 2019 2015 2017 (millions) $ 487 $ 120 Balance, beginning of year Charged to costs and expenses Payments, net of recoveries Balance, end of year 497 130 (140) 503 144 (150) 497 (145) 462 487 The non-current portion of workers' compensation and general liability reserves is included in other liabilities on the Consolidated Balance Sheets. At February 1, 2020 and February 2, 2019, workers' compensation and general liability reserves included $110 million and $112 million, respectively, which are covered by deposits and receivables included in current assets on the Consolidated Balance Sheets. Treasury Stock Common Stock Issued Deferred Compensation Plans Common Stock Outstanding Other Total 333,606 (1,096) (119) (thousands) (28,447) 590 (38) 269 333,606 (946) (106) Balance at January 28, 2017 Stock issued under stock plans Stock repurchases Deferred compensation plan distributions Balance at February 3, 2018 Stock issued under stock plans Stock repurchases Deferred compensation plan distributions Balance at February 2, 2019 Stock issued under stock plans Stock repurchases Deferred compensation plan distributions Balance at February 1, 2020 (27,895) 2.756 (6) (29,543) 471 (38) 269 (28,841) 2,650 (6) 111 (26,086) 1,380 (38) 169 (24,575) 304,063 471 (38) 269 304,765 2,650 (6) 111 307,520 1,380 (38) 169 309,031 333,606 111 (941) (130) (25,145) 1,510 (38) 169 333,606 (902) (23,673) Accumulated Other Comprehensive Loss For the Company, the only component of accumulated other comprehensive loss for 2019, 2018 and 2017 relates to post employment and postretirement plan items. The net actuarial gains and losses and prior service costs and credits related to post employment and postretirement benefit plans are reclassified out of accumulated other comprehensive loss and included in the computation of net periodic benefit cost (income) and are included in benefit plan income, net in the Consolidated Statements of Income. In addition, the Company incurred the pro-rata recognition of net actuarial losses associated with an increase in lump sum distributions associated with store closings, organizational restructuring, and periodic distribution activity as settlement charges in the Consolidated Statements of Income. See Note 9. Retirement Plans, and Note 10, Postretirement Health Care and Life Insurance Benefits, for further information