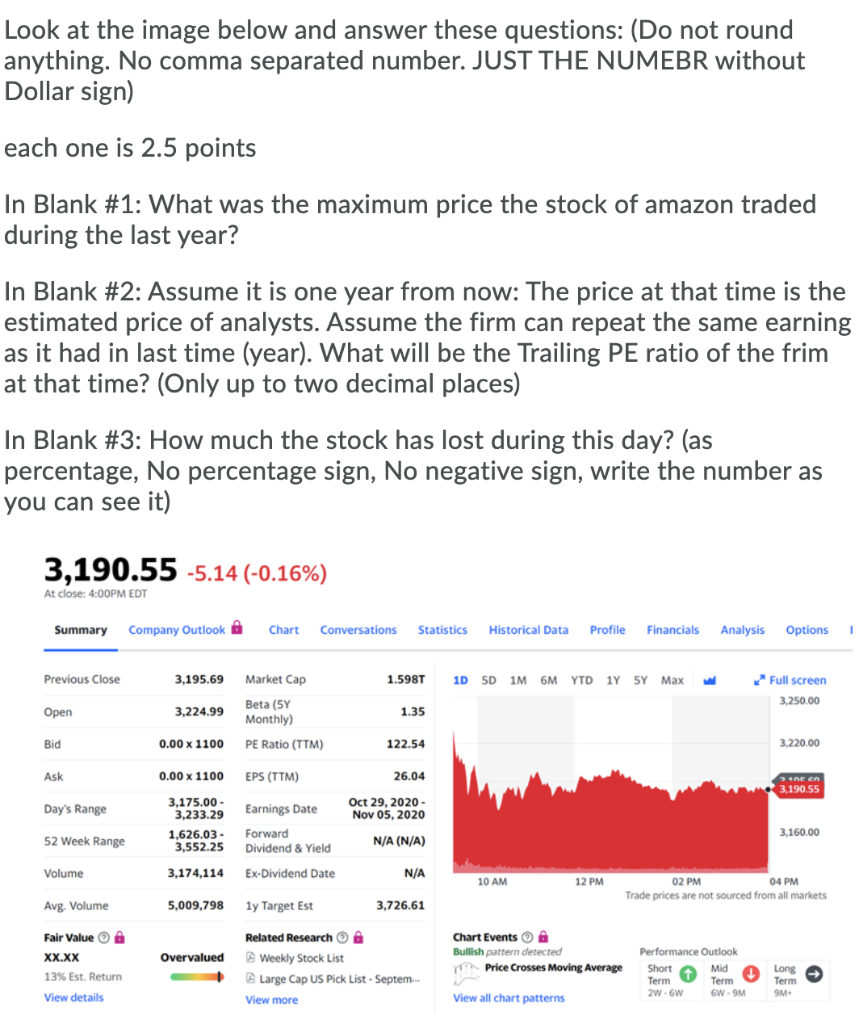
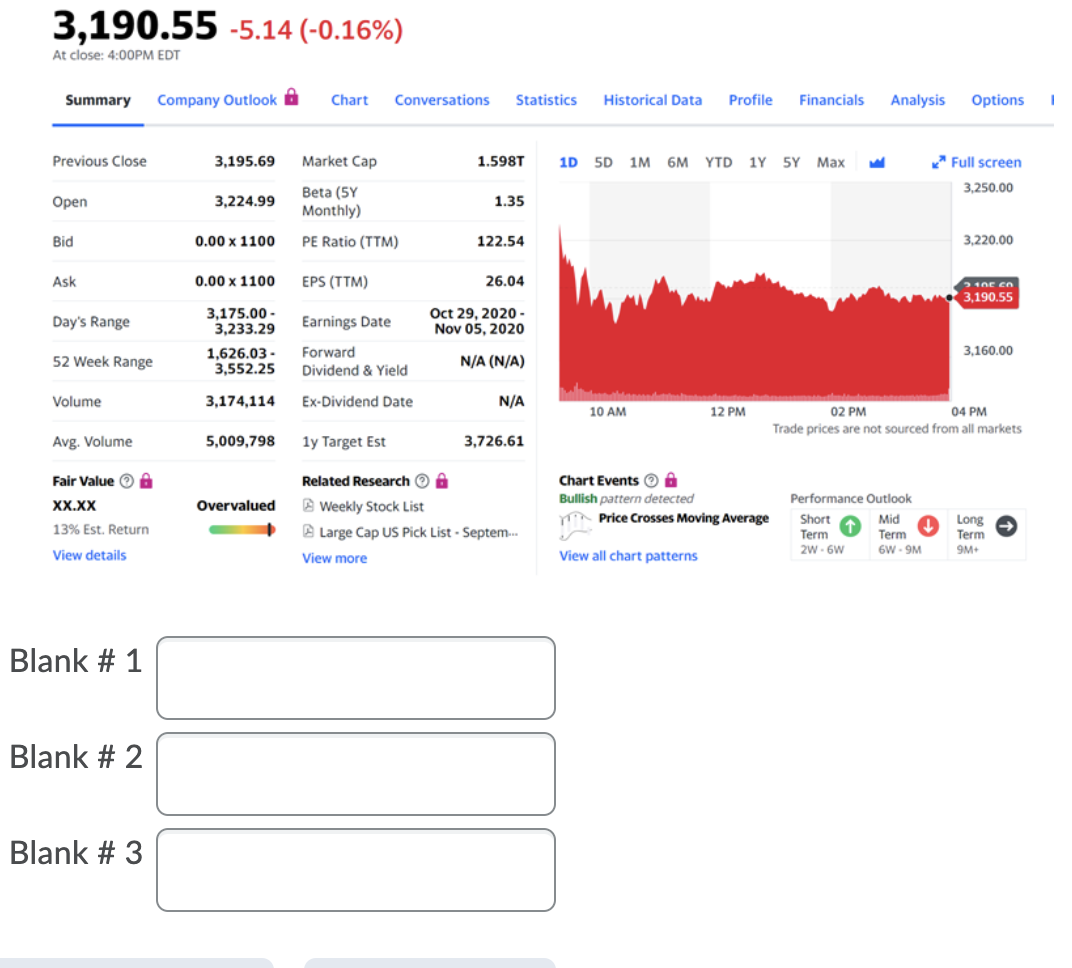
Look at the image below and answer these questions: (Do not round anything. No comma separated number. JUST THE NUMEBR without Dollar sign) each one is 2.5 points In Blank #1: What was the maximum price the stock of amazon traded during the last year? In Blank #2: Assume it is one year from now: The price at that time is the estimated price of analysts. Assume the firm can repeat the same earning as it had in last time (year). What will be the Trailing PE ratio of the frim at that time? (Only up to two decimal places) In Blank #3: How much the stock has lost during this day? (as percentage, No percentage sign, No negative sign, write the number as you can see it) 3,190.55 -5.14 (-0.16%) At close: 4:00PM EDT Summary Company Outlook Chart Conversations Statistics Historical Data Profile Financials Analysis Options Previous Close 3,195.69 Market Cap 1.598T 1D 5D 1M 6M YTD 1Y SY Max Full screen 3.250.00 Open 3,224.99 1.35 Beta (5Y Monthly) PE Ratio (TTM) Bid 0.00 x 1100 122.54 3.220.00 Ask 0.00 x 1100 EPS (TTM) 26.04 une en 3,190.55 Day's Range Oct 29, 2020- Nov 05, 2020 3,175.00 3,233.29 1,626.03 3,552.25 Earnings Date Forward Dividend & Yield 3,160.00 52 Week Range N/A (N/A) Volume 3,174,114 Ex-Dividend Date N/A 10 AM 12 PM 02 PM 04 PM Trade prices are not sourced from all markets Avg. Volume 5,009,798 1y Target Est 3,726.61 Fair Value XX.XX 13% Est. Return Overvalued Related Research Weekly Stock List Large Cap US Pick List - Septem View more Chart Events Bullish pattern detected Price Crosses Moving Average Performance Outlook Short Mid Term Term 2w.tw 6W.9M Long Term 9M View details View all chart patterns 3,190.55 -5.14 (-0.16%) At close: 4:00PM EDT Summary Company Outlook Chart Conversations Statistics Historical Data Profile Financials Analysis Options 1 Previous Close 3,195.69 Market Cap 1.598T 1D 5D 1M 6M YTD 1y 5Y Max ** Full screen 3,250.00 Open 3,224.99 Beta (5Y Monthly) 1.35 Bid 0.00 x 1100 PE Ratio (TTM) 122.54 3,220.00 Ask 0.00 x 1100 EPS (TTM) 26.04 NECA 3,190.55 Day's Range Earnings Date Oct 29, 2020- Nov 05, 2020 3,175.00 - 3,233.29 1,626.03 3,552.25 3.160.00 52 Week Range Forward Dividend & Yield N/A (N/A) Volume 3,174,114 Ex-Dividend Date N/A 10 AM 12 PM 02 PM 04 PM Trade prices are not sourced from all markets Avg. Volume 5,009,798 1y Target Est 3,726.61 Fair Value A XX.XX Overvalued Related Research Weekly Stock List Large Cap US Pick List - Septem... View more Chart Events A Bullish pattern detected Price Crosses Moving Average 13% Est. Return Performance Outlook Short Mid Term Term 2w6W 6W - 9M Long Term 9M+ View details View all chart patterns Blank # 1 Blank # 2 Blank # 3